#XAUUSD @ 1,927.35 Gold price steadies after bouncing off short-term key support confluence, snapping three-day downtrend., @nehcap view: Downside expected (Pivot Orderbook analysis)
…
This is a premium post.
[s2If !current_user_can(access_s2member_level4)]Please register for PREMIUM VERSION HERE to read full post below containing analysis. In case of any error or you think you are not able to read the full post below, please email us at support#nehcap.com [lwa][/s2If] [s2If current_user_can(access_s2member_level4)]
- Gold price steadies after bouncing off short-term key support confluence, snapping three-day downtrend.
- United Stated economics exert downside pressure on US Dollar, favoring XAU/USD buyers.
- US Treasury bond Yields also retreat after three-day uptrend while equities’ recovery underpins Gold demand.
- Federal Reserve’s dovish hike is on the cards but Chairman Jerome Powell can please the Gold bears.
The pair currently trades last at 1927.35.
The previous day high was 1934.54 while the previous day low was 1920.67. The daily 38.2% Fib levels comes at 1925.97, expected to provide support. Similarly, the daily 61.8% fib level is at 1929.24, expected to provide resistance.
Gold price (XAU/USD) struggles to extend the previous day’s recovery beyond $1,930-28 as the market braces for the key Federal Reserve (Fed) verdict on Wednesday. The yellow metal managed to cheer the broad US Dollar weakness, backed by the United States data and firmer equities, as traders brace for a dovish hike from the US central bank.
Gold price snapped a three-day downtrend and bounced off a two-week low the previous day after the US Dollar Index (DXY) reported the first daily loss in four, around 102.10 by the press time. In doing so, the greenback’s gauge versus the six major currencies justified downbeat market expectations from the US Federal Reserve (Fed) amid softer United States statistics.
Among them, the Employment Cost Index (ECI) for the fourth quarter (Q4) gained major attention as it eased to 1.0% versus 1.1% market forecasts and 1.2% prior readings. Further, the Conference Board (CB) Consumer Confidence eased to 107.10 in January versus 108.3 prior. It should be noted that no major attention could be given to the US Chicago Purchasing Managers’ Index (PMI) for January which rose to 44.3 versus 41 expected and 44.9 previous readings.
Not only the downside United States data but the upbeat Wall Street performance, backed by firmer earnings from industry majors like General Motors, Exxon and McDonalds, also seemed to have weighed on the US Treasury bond yields and favored Gold buyers. That said, the benchmark 10-year Treasury bond yields snapped a three-day uptrend while revisiting 3.51% while the two-year counterpart also dropped to 4.20%, near the same levels by the press time.
Apart from the US Dollar driven recovery, the upbeat China Purchasing Managers’ Indexes (PMI) for January and news surrounding COVID-19 from the US also seemed to have favored the Gold buyers. That said, the news suggesting US President Joe Biden’s administration’s readiness to revoke the Covid-led emergencies appeared to have favored the sentiment of late. On Monday, China’s Center for Disease Control and Prevention (CDC) said, reported by Reuters, “China’s current wave of COVID-19 infections is nearing an end, and there was no significant rebound in cases during the Lunar New Year holiday.”
Furthermore, China’s NBS Manufacturing PMI rose to 50.1 versus 49.7 market forecasts and 47.0 prior whereas Non-Manufacturing PMI also came in upbeat with 54.4 figure compared to 51.0 expected and 41.6 previous readings.
Although the Gold sellers have been pushed back ahead of the key Federal Reserve (Fed) Interest Rate Decision, the XAU/USD bears aren’t off the table as the Fed has ammunition to bolster the US Dollar with hawkish rate bias. In doing so, Fed Chair Jerome Powell’s press conference will be crucial amid a widely expected 0.25% rate hike. That said, clues for a further rate increase and no policy pivot in the near term should weigh on the Gold price.
Gold price bounced off a convergence of the 21-Daily Moving Average (DMA) and an upward-sloping trend line from early November 2022 while portraying the previous day’s recovery.
However, the bearish signals from the Moving Average Convergence and Divergence (MACD) indicator join the absence of an overbought Relative Strength Index (RSI) line, placed at 14, to keep sellers hopeful.
With this, the XAU/USD pullback towards the $1,906 support confluence appears imminent.
Following that, the $1,900 threshold and a 10-week-old ascending support line near $1,866 will gain the Gold seller’s attention.
Alternatively, the metal’s further upside could aim for an ascending resistance line stretched from mid-January, close to $1,960 at the latest.
Even if the XAU/USD manages to cross the $1,960 hurdle, the tops marked during March 2022 near $1,966 will challenge the metal ahead of highlighting the $2,000 psychological magnet.
Overall, Gold buyers appear running out of steam but the bears have a tough task ahead.
Trend: Downside expected
Technical Levels: Supports and Resistances
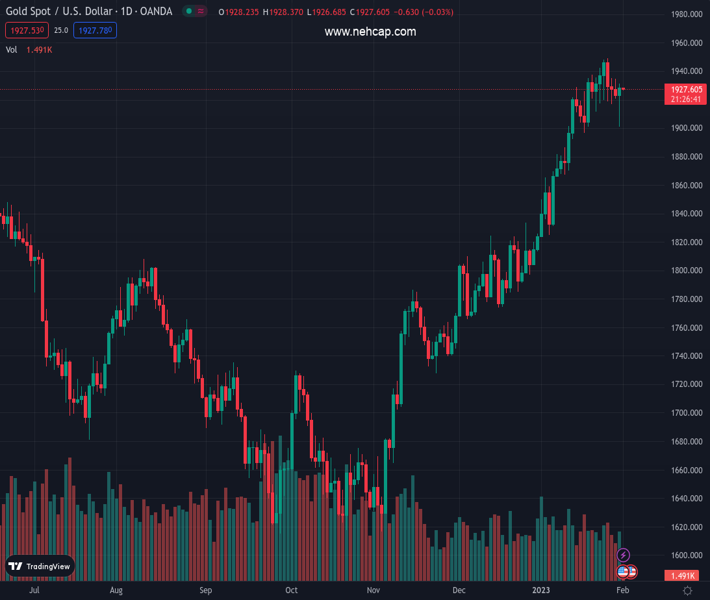
XAUUSD currently trading at 1927.97 at the time of writing. Pair opened at 1922.14 and is trading with a change of 0.30% % .
| Overview | Overview.1 | |
|---|---|---|
| 0 | Today last price | 1927.97 |
| 1 | Today Daily Change | 5.83 |
| 2 | Today Daily Change % | 0.30% |
| 3 | Today daily open | 1922.14 |
The pair remains strongly bullish on the daily timeframe. It trades above its 20 SMA @ 1901.06, 50 SMA 1832.91, 100 SMA @ 1757.26 and 200 SMA @ 1775.6.
| Trends | Trends.1 | |
|---|---|---|
| 0 | Daily SMA20 | 1901.06 |
| 1 | Daily SMA50 | 1832.91 |
| 2 | Daily SMA100 | 1757.26 |
| 3 | Daily SMA200 | 1775.60 |
The previous day high was 1934.54 while the previous day low was 1920.67. The daily 38.2% Fib levels comes at 1925.97, expected to provide support. Similarly, the daily 61.8% fib level is at 1929.24, expected to provide resistance.
Note the levels of interest below:
- Pivot support is noted at 1917.03, 1911.91, 1903.16
- Pivot resistance is noted at 1930.9, 1939.65, 1944.77
| Levels | Levels.1 |
|---|---|
| Previous Daily High | 1934.54 |
| Previous Daily Low | 1920.67 |
| Previous Weekly High | 1949.27 |
| Previous Weekly Low | 1911.45 |
| Previous Monthly High | 1833.38 |
| Previous Monthly Low | 1765.89 |
| Daily Fibonacci 38.2% | 1925.97 |
| Daily Fibonacci 61.8% | 1929.24 |
| Daily Pivot Point S1 | 1917.03 |
| Daily Pivot Point S2 | 1911.91 |
| Daily Pivot Point S3 | 1903.16 |
| Daily Pivot Point R1 | 1930.90 |
| Daily Pivot Point R2 | 1939.65 |
| Daily Pivot Point R3 | 1944.77 |
[/s2If]
Join Our Telegram Group


