#USDCAD @ 1.33699 picks up bids to reverse intraday losses, probes two-day downtrend., @nehcap view: Limited downside expected (Pivot Orderbook analysis)
…
This is a premium post.
[s2If !current_user_can(access_s2member_level4)]Please register for PREMIUM VERSION HERE to read full post below containing analysis. In case of any error or you think you are not able to read the full post below, please email us at support#nehcap.com [lwa][/s2If] [s2If current_user_can(access_s2member_level4)]
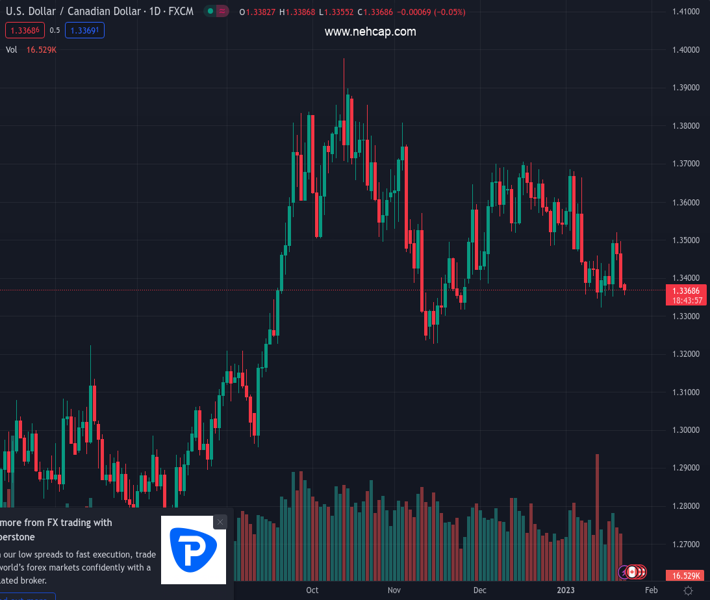
- USD/CAD picks up bids to reverse intraday losses, probes two-day downtrend.
- Multiple moving averages stand tall to challenge recovery moves.
- MACD, RSI conditions suggest further weakness but 10-week-old support line restricts immediate downside.
The pair currently trades last at 1.33699.
The previous day high was 1.3498 while the previous day low was 1.3378. The daily 38.2% Fib levels comes at 1.3423, expected to provide resistance. Similarly, the daily 61.8% fib level is at 1.3452, expected to provide resistance.
USD/CAD licks its wounds during a sluggish Monday morning as the pre-Fed blackout joins the Lunar New Year holidays in China. Even so, the bears remain hopeful as the quote extends the previous day’s pullback from the key moving averages. That said, the Loonie pair reverses the week-start losses near 1.3375 by the press time.
Not only a slew of moving averages but the bearish MACD signals and the mostly steady RSI (14) also keep the USD/CAD sellers hopeful of visiting an upward-sloping support line from November 15, 2022, around 1.3335 at the latest.
It should be noted that the quote’s weakness past 1.3335 could make it vulnerable to dropping toward the September swing high near 1.3205. However, the 200-DMA support of around 1.3195 could challenge the USD/CAD bears afterward.
In a case where the USD/CAD bears keep the reins past 1.3195, the 1.3000 psychological magnet will be in focus.
Alternatively, the 21-DMA guards the pair’s immediate upside around 1.3480 ahead of the convergence of the 50-DMA and the 100-DMA, close to 1.3510-20.
If at all the USD/CAD buyers manage to cross the 1.3520 hurdle, a downward-sloping resistance line from October 13, 2022, near 1.3615, could act as the last defense of the pair sellers.
Overall, USD/CAD remains on the bear’s radar even if the 2.5-month-old support line limits nearby declines.
Trend: Limited downside expected
Technical Levels: Supports and Resistances
USDCAD currently trading at 1.3377 at the time of writing. Pair opened at 1.3381 and is trading with a change of -0.03% % .
| Overview | Overview.1 | |
|---|---|---|
| 0 | Today last price | 1.3377 |
| 1 | Today Daily Change | -0.0004 |
| 2 | Today Daily Change % | -0.03% |
| 3 | Today daily open | 1.3381 |
The pair is trading below its 20 Daily moving average @ 1.3486, below its 50 Daily moving average @ 1.35 , below its 100 Daily moving average @ 1.3513 and above its 200 Daily moving average @ 1.319
| Trends | Trends.1 | |
|---|---|---|
| 0 | Daily SMA20 | 1.3486 |
| 1 | Daily SMA50 | 1.3500 |
| 2 | Daily SMA100 | 1.3513 |
| 3 | Daily SMA200 | 1.3190 |
The previous day high was 1.3498 while the previous day low was 1.3378. The daily 38.2% Fib levels comes at 1.3423, expected to provide resistance. Similarly, the daily 61.8% fib level is at 1.3452, expected to provide resistance.
Note the levels of interest below:
- Pivot support is noted at 1.334, 1.3299, 1.322
- Pivot resistance is noted at 1.346, 1.3539, 1.358
| Levels | Levels.1 |
|---|---|
| Previous Daily High | 1.3498 |
| Previous Daily Low | 1.3378 |
| Previous Weekly High | 1.3521 |
| Previous Weekly Low | 1.3351 |
| Previous Monthly High | 1.3705 |
| Previous Monthly Low | 1.3385 |
| Daily Fibonacci 38.2% | 1.3423 |
| Daily Fibonacci 61.8% | 1.3452 |
| Daily Pivot Point S1 | 1.3340 |
| Daily Pivot Point S2 | 1.3299 |
| Daily Pivot Point S3 | 1.3220 |
| Daily Pivot Point R1 | 1.3460 |
| Daily Pivot Point R2 | 1.3539 |
| Daily Pivot Point R3 | 1.3580 |
[/s2If]
Join Our Telegram Group
")


