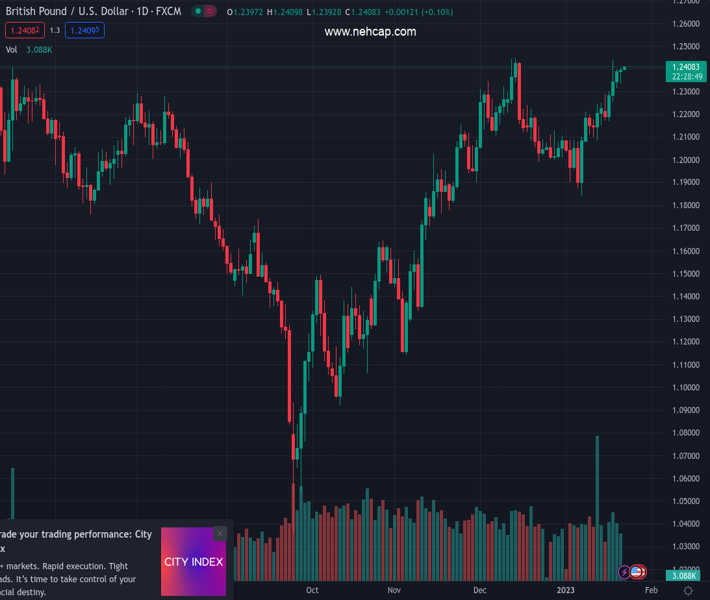
#GBPUSD @ 1.24082 picks up bids to refresh intraday high; extends previous two-week winning streak., @nehcap view: Limited upside expected (Pivot Orderbook analysis)
…
This is a premium post.
[s2If !current_user_can(access_s2member_level4)]Please register for PREMIUM VERSION HERE to read full post below containing analysis. In case of any error or you think you are not able to read the full post below, please email us at support#nehcap.com [lwa][/s2If] [s2If current_user_can(access_s2member_level4)]
- GBP/USD picks up bids to refresh intraday high; extends previous two-week winning streak.
- RSI conditions, six-week-old resistance line challenge Cable buyers.
- 21-SMA, ascending trend line from early January puts a floor under the price.
The pair currently trades last at 1.24082.
The previous day high was 1.2404 while the previous day low was 1.2335. The daily 38.2% Fib levels comes at 1.2378, expected to provide support. Similarly, the daily 61.8% fib level is at 1.2362, expected to provide support.
GBP/USD stays on the front foot as bulls keep the driver’s seat during early Monday morning in Asia, after a two-week uptrend. That said, the Cable pair renews its intraday high near 1.2410 while rising for the fifth consecutive day as of late.
In doing so, the quote extends the previous day’s rebound from the 21-SMA, around 1.2350 by the press time.
In addition to the 21-SMA, an upward-sloping support line from January 06, close to 1.2340 at the latest, also restricts the short-term downside of the Cable pair.
Should the quote drops below 1.2340 support, the 200-SMA level surrounding 1.2165 will act as the last defense of the GBP/USD pair buyers, a break of which won’t hesitate to give control to the bears targeting the 1.2000 psychological magnet.
It’s worth noting that the RSI (14) is near the overbought territory, which in turn highlights a 1.5-month-old resistance line near 1.2435 as the key challenge for the GBP/USD bulls.
Following that, the previous monthly high near 1.2450 will be crucial to watch as a clear upside break of the same could propel the quote toward May 2022 high near 1.2670.
In a case where the GBP/USD price remains firmer past 1.2670, the March 2022 low around the 1.3000 round figure will be in focus.
Trend: Limited upside expected
Technical Levels: Supports and Resistances
GBPUSD currently trading at 1.2409 at the time of writing. Pair opened at 1.2395 and is trading with a change of 0.11% % .
| Overview | Overview.1 | |
|---|---|---|
| 0 | Today last price | 1.2409 |
| 1 | Today Daily Change | 0.0014 |
| 2 | Today Daily Change % | 0.11% |
| 3 | Today daily open | 1.2395 |
The pair remains strongly bullish on the daily timeframe. It trades above its 20 SMA @ 1.2143, 50 SMA 1.211, 100 SMA @ 1.1724 and 200 SMA @ 1.1978.
| Trends | Trends.1 | |
|---|---|---|
| 0 | Daily SMA20 | 1.2143 |
| 1 | Daily SMA50 | 1.2110 |
| 2 | Daily SMA100 | 1.1724 |
| 3 | Daily SMA200 | 1.1978 |
The previous day high was 1.2404 while the previous day low was 1.2335. The daily 38.2% Fib levels comes at 1.2378, expected to provide support. Similarly, the daily 61.8% fib level is at 1.2362, expected to provide support.
Note the levels of interest below:
- Pivot support is noted at 1.2352, 1.2309, 1.2283
- Pivot resistance is noted at 1.2421, 1.2447, 1.249
| Levels | Levels.1 |
|---|---|
| Previous Daily High | 1.2404 |
| Previous Daily Low | 1.2335 |
| Previous Weekly High | 1.2436 |
| Previous Weekly Low | 1.2169 |
| Previous Monthly High | 1.2447 |
| Previous Monthly Low | 1.1992 |
| Daily Fibonacci 38.2% | 1.2378 |
| Daily Fibonacci 61.8% | 1.2362 |
| Daily Pivot Point S1 | 1.2352 |
| Daily Pivot Point S2 | 1.2309 |
| Daily Pivot Point S3 | 1.2283 |
| Daily Pivot Point R1 | 1.2421 |
| Daily Pivot Point R2 | 1.2447 |
| Daily Pivot Point R3 | 1.2490 |
[/s2If]
Join Our Telegram Group
")


