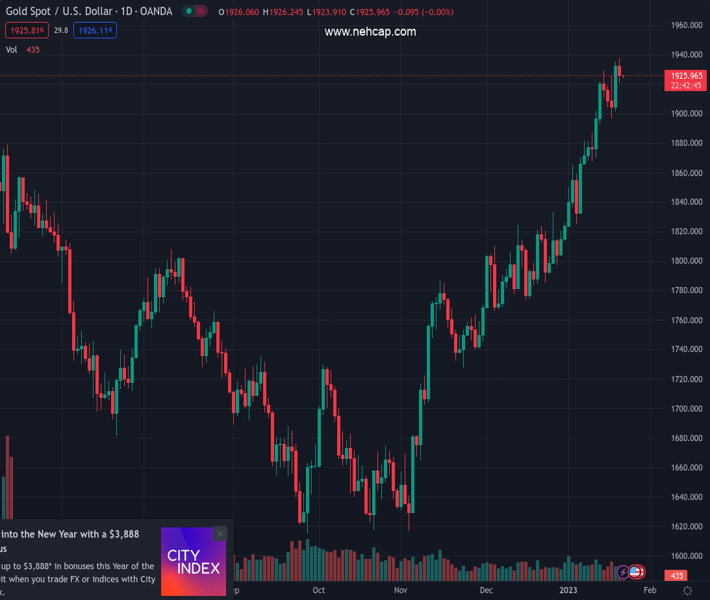
#XAUUSD @ 1,925.74 Gold price remains sidelined near nine-month high after a five-week uptrend., @nehcap view: Bullish (Pivot Orderbook analysis)
…
This is a premium post.
[s2If !current_user_can(access_s2member_level4)]Please register for PREMIUM VERSION HERE to read full post below containing analysis. In case of any error or you think you are not able to read the full post below, please email us at support#nehcap.com [lwa][/s2If] [s2If current_user_can(access_s2member_level4)]
- Gold price remains sidelined near nine-month high after a five-week uptrend.
- Mixed signals from Federal Reserve, mostly downbeat United States data improved sentiment and propelled Gold prices of late.
- Lunar New Year holidays in China, Fed’s ‘Blackout period’ may challenge XAU/USD traders.
- Purchasing Managers Indexes, Gross Domestic Product will be crucial for fresh impulse.
The pair currently trades last at 1925.74.
The previous day high was 1937.57 while the previous day low was 1920.71. The daily 38.2% Fib levels comes at 1927.15, expected to provide resistance. Similarly, the daily 61.8% fib level is at 1931.13, expected to provide resistance.
Gold price (XAU/USD) prints mild losses around $1,925 as bulls take a breather after a five-week uptrend, especially amid a lack of traders from China and the Federal Reserve’s (Fed) silence period. Even so, the bright metal stays near the highest levels since April 2022 as XAU/USD bulls await the first readings of activity data for January and the advanced estimates of the United States’ Gross Domestic Product (GDP) for the fourth quarter (Q4) 2022.
That said, the Gold buyers cheered upbeat sentiment and the US Dollar’s weakness, mainly due to China-inspired market optimism, softer data from the United States and mixed comments from the Federal Reserve (Fed) officials.
US Dollar Index (DXY) holds lower ground at the lowest levels since May 31, 2022, tested the last week, even as the latest comments from the US Federal Reserve (Fed) officials ahead of a two-week ‘blackout period’ before the Fed meeting favored further rate hikes. The reason could be linked to the market’s belief that the Fed is near to the policy pivot even if it is all set to announce a 0.25% interest rate increase in the February meeting.
Federal Reserve Governor Christopher Waller was the last from the US central bank speakers to cross the wires before the stipulated mum-period ahead of the February Federal Open Market Committee (FOMC) meeting. The policymaker said, “He favors a 25 basis point rate hike at the upcoming meeting and continued policy tightening beyond that.” Talking about the data, US Retail Sales and regional activity numbers were downbeat enough to hint at a “soft landing” of the world’s largest economy, which in turn weighed on the US Dollar and underpinned the Gold price.
While the US Dollar weakness underpinned the Gold price run-up, upbeat headlines surrounding China, one of the world’s biggest XAU/USD users, also favored the metal buyers. Among the key headlines, chatters suggesting a pick-up in the demand ahead of the week-long Lunar New Year Holidays and the People’s Bank of China’s (PBOC) rejection to alter the current monetary policy strength the risk-on mood, as well as the Gold price.
Risk-on mood favors Gold buyers
Be it the talks surrounding the Federal Reserve’s policy pivot or China reopening, market sentiment remained positive and underpinned the Gold buying in the last few weeks. While portraying the mood, the United States Treasury bond yields dropped to the multi-day low as traders rushed for riskier assets. That said, the benchmark US 10-year Treasury bond yields portrayed a three-week downtrend before bouncing back to 3.48%.
Even if the Federal Reserve’s ‘black out’ period and Lunar New Year holidays in China may restrict market moves, the presence of the first readings of January’s Purchasing Managers Indexes for the United States, Europe, the UK and Australia will entertain Gold traders. Additionally important will be the advance forecasts of the US four quarter (Q4) Gross Domestic Product (GDP). It’s worth noting that the market consensus does suggest softer prints for the US and the same could weigh on the US Dollar, while also allowing the Gold buyers to keep the reins.
Also read: Gold Price Weekly Forecast: XAU/USD could extend uptrend to $1,950; US GDP in spotlight
After consecutive five positive weeks and refreshing multi-day high, the XAU/USD price seesaws inside a three-day-old symmetrical triangle as bulls take a breather while keeping the reins.
That said, above 50 level of the Relative Strength Index (RSI) line, placed at 14, as well as the Moving Average Convergence and Divergence (MACD) indicator’s easing bearish signals keeps the buyers hopeful.
Additionally, the Gold price also defends Thursday’s breakout of a one-week-old descending trend line inside the aforementioned triangle formation, now support around $1,922.
Even if the quote breaks the stated resistance-turned-support line, an upward-sloping support line from January 11 and the 200-Hour Moving Average (HMA), respectively near $1,913 and $1,904, could probe the XAU/USD bulls before the $1,900 key support.
In a case where the Gold price drops below $1,900, the March 2022 low near $1,890 will act as the final defense of buyers.
Alternatively, the aforementioned triangle’s resistance line, close to $1,930 at the latest, restricts the immediate upside of the Gold price.
Following that, a gradual run-up towards March 2022 peak surrounding $1,965 can’t be ruled out.
Overall, the Gold price remains firmer even if the buyers are less active of late.
Trend: Bullish
Technical Levels: Supports and Resistances
XAUUSD currently trading at 1925.4 at the time of writing. Pair opened at 1927.24 and is trading with a change of -0.1 % .
| Overview | Overview.1 | |
|---|---|---|
| 0 | Today last price | 1925.40 |
| 1 | Today Daily Change | -1.84 |
| 2 | Today Daily Change % | -0.10 |
| 3 | Today daily open | 1927.24 |
The pair remains strongly bullish on the daily timeframe. It trades above its 20 SMA @ 1865.17, 50 SMA 1812.5, 100 SMA @ 1744.14 and 200 SMA @ 1775.96.
| Trends | Trends.1 | |
|---|---|---|
| 0 | Daily SMA20 | 1865.17 |
| 1 | Daily SMA50 | 1812.50 |
| 2 | Daily SMA100 | 1744.14 |
| 3 | Daily SMA200 | 1775.96 |
The previous day high was 1937.57 while the previous day low was 1920.71. The daily 38.2% Fib levels comes at 1927.15, expected to provide resistance. Similarly, the daily 61.8% fib level is at 1931.13, expected to provide resistance.
Note the levels of interest below:
- Pivot support is noted at 1919.44, 1911.65, 1902.58
- Pivot resistance is noted at 1936.3, 1945.37, 1953.16
| Levels | Levels.1 |
|---|---|
| Previous Daily High | 1937.57 |
| Previous Daily Low | 1920.71 |
| Previous Weekly High | 1937.57 |
| Previous Weekly Low | 1896.63 |
| Previous Monthly High | 1833.38 |
| Previous Monthly Low | 1765.89 |
| Daily Fibonacci 38.2% | 1927.15 |
| Daily Fibonacci 61.8% | 1931.13 |
| Daily Pivot Point S1 | 1919.44 |
| Daily Pivot Point S2 | 1911.65 |
| Daily Pivot Point S3 | 1902.58 |
| Daily Pivot Point R1 | 1936.30 |
| Daily Pivot Point R2 | 1945.37 |
| Daily Pivot Point R3 | 1953.16 |
[/s2If]
Join Our Telegram Group
")


