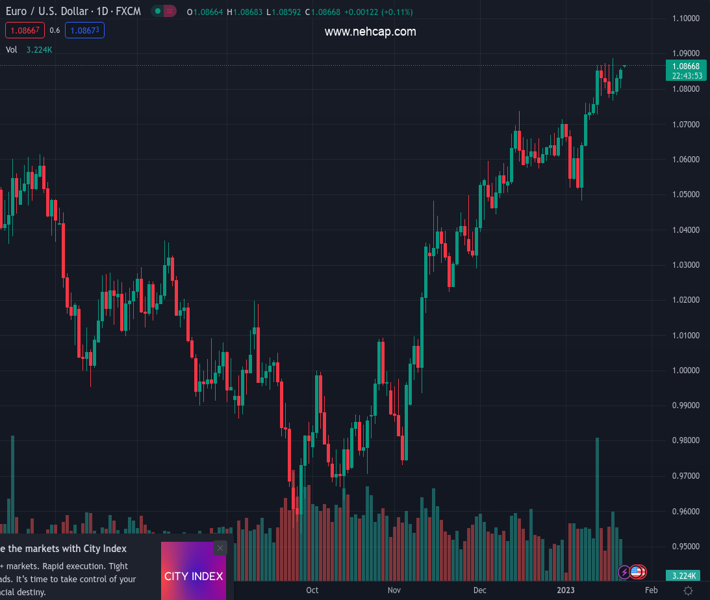
#EURUSD @ 1.08629 extends previous two-week uptrend with mild gains. (Pivot Orderbook analysis)
…
This is a premium post.
[s2If !current_user_can(access_s2member_level4)]Please register for PREMIUM VERSION HERE to read full post below containing analysis. In case of any error or you think you are not able to read the full post below, please email us at support#nehcap.com [lwa][/s2If] [s2If current_user_can(access_s2member_level4)]
- EUR/USD extends previous two-week uptrend with mild gains.
- ECB’s Knot, Rehn suggest higher rates, push back against policy pivot chatters.
- Fed policymakers tried to please hawks but failed amid softer US data.
- January’s PMI, US Q4 Advances GDP will be crucial for immediate directions.
The pair currently trades last at 1.08629.
The previous day high was 1.0859 while the previous day low was 1.0802. The daily 38.2% Fib levels comes at 1.0838, expected to provide support. Similarly, the daily 61.8% fib level is at 1.0824, expected to provide support.
EUR/USD prints mild gains around 1.0865 during the three-day winning streak amid the early hours of Monday’s Asian session, following a two-week uptrend. In doing so, the major currency pair justifies the recently hawkish comments from the European Central Bank (ECB) officials while also portraying the cautious mood of traders ahead of this week’s bumper data.
That said, ECB Governing Council member and Governor of Austria’s central bank Olli Rehn recently flagged the central bank’s readiness for stronger rate hikes while saying, “I see grounds for large rate hikes in spring.” On the same line, Dutch central bank governor and ECB Governing Council member Klaas Knot stated that ECB is set to raise interest rates by 50 basis points in both February and March and will continue to raise rates in the months after.
It’s worth noting that the Fed officials were also hawkish ahead of the two-week-long pre-FOMC (Federal Open Market Committee) blackout period. Federal Reserve Governor Christopher Waller was the last from the US central bank speakers to cross the wires. The policymaker said, “He favors a 25 basis point rate hike at the upcoming meeting and continued policy tightening beyond that.”
Although the ECB and the Fed hawks are head-to-head in convincing markets of their ability to increase the benchmark rates, the fears of economic slowdown and easing inflation concerns seem to allow traders to rush toward the riskier assets. The same weigh on the US Dollar’s haven demand even if the US Treasury bond yields managed to bounce off a multi-day low to 3.48% by the end of the last week.
Additionally, the recently upbeat comments from the European authorities, expecting softer economic contraction than initially feared, also underpin the EUR/USD upside. However, the geopolitical tension surrounding Russia and China, as well as the US Dollar’s reserve currency status probes the pair buyers.
That said, the EUR/USD traders may wait for more clues to extend the latest run-up, which in turn highlights today’s Eurozone Consumer Confidence for January, expected -22.5 versus -22.2 prior, for intraday directions. However, major attention will be given to the first readings of January’s Purchasing Managers Indexes for the United States, Europe, the UK and Australia will entertain Gold traders. Additionally important will be the advance forecasts of the US four quarter (Q4) Gross Domestic Product (GDP).
Also read: EUR/USD Weekly Forecast: Growth under scrutiny ahead of central banks’ decisions
Although overbought RSI and the 1.0900 hurdle challenged EUR/USD bulls of late, a five-week-old resistance-turned-support line, near 1.0780, restricts the bear’s entry.
Technical Levels: Supports and Resistances
EURUSD currently trading at 1.0863 at the time of writing. Pair opened at 1.0856 and is trading with a change of 0.06% % .
| Overview | Overview.1 | |
|---|---|---|
| 0 | Today last price | 1.0863 |
| 1 | Today Daily Change | 0.0007 |
| 2 | Today Daily Change % | 0.06% |
| 3 | Today daily open | 1.0856 |
The pair remains strongly bullish on the daily timeframe. It trades above its 20 SMA @ 1.0711, 50 SMA 1.0571, 100 SMA @ 1.0232 and 200 SMA @ 1.031.
| Trends | Trends.1 | |
|---|---|---|
| 0 | Daily SMA20 | 1.0711 |
| 1 | Daily SMA50 | 1.0571 |
| 2 | Daily SMA100 | 1.0232 |
| 3 | Daily SMA200 | 1.0310 |
The previous day high was 1.0859 while the previous day low was 1.0802. The daily 38.2% Fib levels comes at 1.0838, expected to provide support. Similarly, the daily 61.8% fib level is at 1.0824, expected to provide support.
Note the levels of interest below:
- Pivot support is noted at 1.0819, 1.0782, 1.0762
- Pivot resistance is noted at 1.0876, 1.0896, 1.0933
| Levels | Levels.1 |
|---|---|
| Previous Daily High | 1.0859 |
| Previous Daily Low | 1.0802 |
| Previous Weekly High | 1.0888 |
| Previous Weekly Low | 1.0766 |
| Previous Monthly High | 1.0736 |
| Previous Monthly Low | 1.0393 |
| Daily Fibonacci 38.2% | 1.0838 |
| Daily Fibonacci 61.8% | 1.0824 |
| Daily Pivot Point S1 | 1.0819 |
| Daily Pivot Point S2 | 1.0782 |
| Daily Pivot Point S3 | 1.0762 |
| Daily Pivot Point R1 | 1.0876 |
| Daily Pivot Point R2 | 1.0896 |
| Daily Pivot Point R3 | 1.0933 |
[/s2If]
Join Our Telegram Group
")


