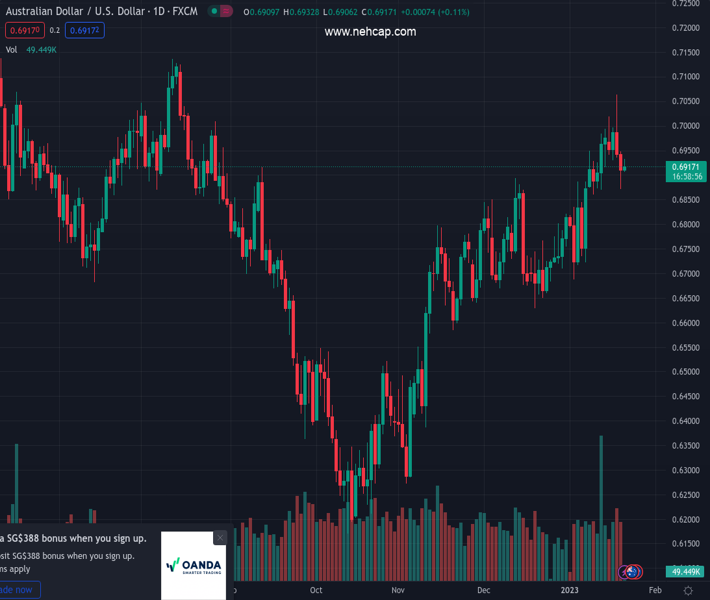
#AUDUSD @ 0.69167 gains some positive traction on Friday, though lacks follow-through. (Pivot Orderbook analysis)
…
This is a premium post.
[s2If !current_user_can(access_s2member_level4)]Please register for PREMIUM VERSION HERE to read full post below containing analysis. In case of any error or you think you are not able to read the full post below, please email us at support#nehcap.com [lwa][/s2If] [s2If current_user_can(access_s2member_level4)]
- AUD/USD gains some positive traction on Friday, though lacks follow-through.
- The USD benefits from rebounding US bond yields and caps gains for the pair.
- A mildly positive risk tone might act as a tailwind for the risk-sensitive Aussie.
The pair currently trades last at 0.69167.
The previous day high was 0.6948 while the previous day low was 0.6872. The daily 38.2% Fib levels comes at 0.6901, expected to provide support. Similarly, the daily 61.8% fib level is at 0.6919, expected to provide resistance.
The AUD/USD pair edges higher during the Asian session on Friday and recovers further from over a one-week low, around the 0.6870 region touched the previous day. The pair, however, trims a part of its modest intraday gains and is currently placed around the 0.6920-0.6915 area, up less than 0.15% for the day.
The US Treasury bond yields build on the overnight recovery from a four-month low and lend some support to the US Dollar, which, in turn, acts as a headwind for the AUD/USD pair. The upbeat US macro data released on Thursday, along with fresh hawkish rhetoric from Fed officials, is seen pushing the US Treasury bond yields higher and underpinning the greenback.
The markets, however, continue to price in a greater chance of a smaller 25 bps Fed rate hike in February. This should keep a lid on any meaningful upside for the US bond yields and the USD. Apart from this, a generally positive tone around the Asian equity markets could benefit the risk-sensitive Aussie and help limit the downside for the AUD/USD pair.
Investors turn optimistic over a recovery in the world’s second-largest economy after China kept its key lending rates at historic lows for a fifth straight month. The move indicates that the government plans to keep liquidity conditions loose in order to spur an economic recovery. This might hold back traders from placing bearish bets around the AUD/USD pair.
Hence, it will be prudent to wait for strong follow-through selling before positioning for an extension of this week’s sharp retracement slide from the highest level since mid-August. Market participants now look to the US Existing Homes Sales data, which, along with speeches by influential FOMC members, will drive the USD and provide some impetus to the AUD/USD pair.
Technical Levels: Supports and Resistances
AUDUSD currently trading at 0.6919 at the time of writing. Pair opened at 0.6912 and is trading with a change of 0.1 % .
| Overview | Overview.1 | |
|---|---|---|
| 0 | Today last price | 0.6919 |
| 1 | Today Daily Change | 0.0007 |
| 2 | Today Daily Change % | 0.1000 |
| 3 | Today daily open | 0.6912 |
The pair remains strongly bullish on the daily timeframe. It trades above its 20 SMA @ 0.6847, 50 SMA 0.6775, 100 SMA @ 0.6639 and 200 SMA @ 0.6822.
| Trends | Trends.1 | |
|---|---|---|
| 0 | Daily SMA20 | 0.6847 |
| 1 | Daily SMA50 | 0.6775 |
| 2 | Daily SMA100 | 0.6639 |
| 3 | Daily SMA200 | 0.6822 |
The previous day high was 0.6948 while the previous day low was 0.6872. The daily 38.2% Fib levels comes at 0.6901, expected to provide support. Similarly, the daily 61.8% fib level is at 0.6919, expected to provide resistance.
Note the levels of interest below:
- Pivot support is noted at 0.6874, 0.6835, 0.6797
- Pivot resistance is noted at 0.695, 0.6987, 0.7026
| Levels | Levels.1 |
|---|---|
| Previous Daily High | 0.6948 |
| Previous Daily Low | 0.6872 |
| Previous Weekly High | 0.6994 |
| Previous Weekly Low | 0.6860 |
| Previous Monthly High | 0.6893 |
| Previous Monthly Low | 0.6629 |
| Daily Fibonacci 38.2% | 0.6901 |
| Daily Fibonacci 61.8% | 0.6919 |
| Daily Pivot Point S1 | 0.6874 |
| Daily Pivot Point S2 | 0.6835 |
| Daily Pivot Point S3 | 0.6797 |
| Daily Pivot Point R1 | 0.6950 |
| Daily Pivot Point R2 | 0.6987 |
| Daily Pivot Point R3 | 0.7026 |
[/s2If]
Join Our Telegram Group
")


