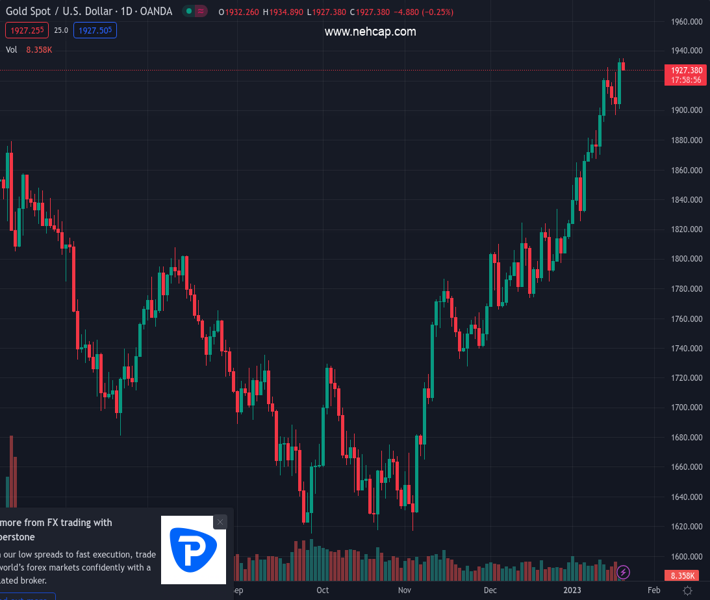
#XAUUSD @ 1,927.63 Gold price is struggling to sustain above the immediate resistance of $1.930.00. (Pivot Orderbook analysis)
…
This is a premium post.
[s2If !current_user_can(access_s2member_level4)]Please register for PREMIUM VERSION HERE to read full post below containing analysis. In case of any error or you think you are not able to read the full post below, please email us at support#nehcap.com [lwa][/s2If] [s2If current_user_can(access_s2member_level4)]
- Gold price is struggling to sustain above the immediate resistance of $1.930.00.
- Hawkish commentary from Fed policymakers is strengthening the US Treasury yields.
- According to a Reuters survey, the Fed will pause the policy tightening program after two 25 bps rate hikes.
The pair currently trades last at 1927.63.
The previous day high was 1935.27 while the previous day low was 1901.0. The daily 38.2% Fib levels comes at 1922.18, expected to provide support. Similarly, the daily 61.8% fib level is at 1914.09, expected to provide support.
Gold price (XAU/USD) is witnessing selling pressure in sustaining above the critical resistance of $1,930.00 in the Asian session. The precious metal is struggling to extend gains as hawkish commentaries from various Federal Reserve (Fed) policymakers.
S&P500 futures are trying hard to hold early Asian gains, however, it is difficult to consider it a recovery in the risk-appetite theme. The demand for US government bonds is easing as the Fed is expected to continue higher interest rates for a decent period. The 10-year US Treasury yields have scaled to near 3.42%. Meanwhile, the US Dollar Index (DXY) is displaying a lackluster performance, oscillating in a narrow range above 101.60.
No doubt, the signs of declining inflation through the lens of economic slowdown, decelerating Producer Price Index (PPI) numbers, and weaker retail demand are compelling, but the inflation rate is still extremely far from the 2% inflation target. Therefore, a continuation of the interest rates announcement by the Fed cannot be ruled out.
From the outcome of a survey, Reuters claims that Fed chair Jerome Powell will pause the policy tightening program for the rest of CY2023 after hiking interest rates by 25 basis points (bps) in the next two monetary policy meetings.
Gold price is set for a fresh upside as the asset has delivered a breakout of the Symmetrical Triangle chart pattern on an hourly scale. The breakout of the volatility contraction chart pattern seems solid as the size of ticks after the breakout was wider than average.
Upward-sloping 20-and 50-period Exponential Moving Averages (EMAs) at $1,923.91 and $1,917.54 respectively, add to the upside filters.
The Relative Strength Index (RSI) (14) is oscillating in a bullish range of 60.00-80.00, which indicates that the upside momentum is active.
Technical Levels: Supports and Resistances
XAUUSD currently trading at 1928.8 at the time of writing. Pair opened at 1933.54 and is trading with a change of -0.25 % .
| Overview | Overview.1 | |
|---|---|---|
| 0 | Today last price | 1928.80 |
| 1 | Today Daily Change | -4.74 |
| 2 | Today Daily Change % | -0.25 |
| 3 | Today daily open | 1933.54 |
The pair remains strongly bullish on the daily timeframe. It trades above its 20 SMA @ 1858.69, 50 SMA 1809.31, 100 SMA @ 1741.99 and 200 SMA @ 1776.2.
| Trends | Trends.1 | |
|---|---|---|
| 0 | Daily SMA20 | 1858.69 |
| 1 | Daily SMA50 | 1809.31 |
| 2 | Daily SMA100 | 1741.99 |
| 3 | Daily SMA200 | 1776.20 |
The previous day high was 1935.27 while the previous day low was 1901.0. The daily 38.2% Fib levels comes at 1922.18, expected to provide support. Similarly, the daily 61.8% fib level is at 1914.09, expected to provide support.
Note the levels of interest below:
- Pivot support is noted at 1911.27, 1889.0, 1877.0
- Pivot resistance is noted at 1945.54, 1957.54, 1979.81
| Levels | Levels.1 |
|---|---|
| Previous Daily High | 1935.27 |
| Previous Daily Low | 1901.00 |
| Previous Weekly High | 1921.96 |
| Previous Weekly Low | 1865.22 |
| Previous Monthly High | 1833.38 |
| Previous Monthly Low | 1765.89 |
| Daily Fibonacci 38.2% | 1922.18 |
| Daily Fibonacci 61.8% | 1914.09 |
| Daily Pivot Point S1 | 1911.27 |
| Daily Pivot Point S2 | 1889.00 |
| Daily Pivot Point S3 | 1877.00 |
| Daily Pivot Point R1 | 1945.54 |
| Daily Pivot Point R2 | 1957.54 |
| Daily Pivot Point R3 | 1979.81 |
[/s2If]
Join Our Telegram Group
")


