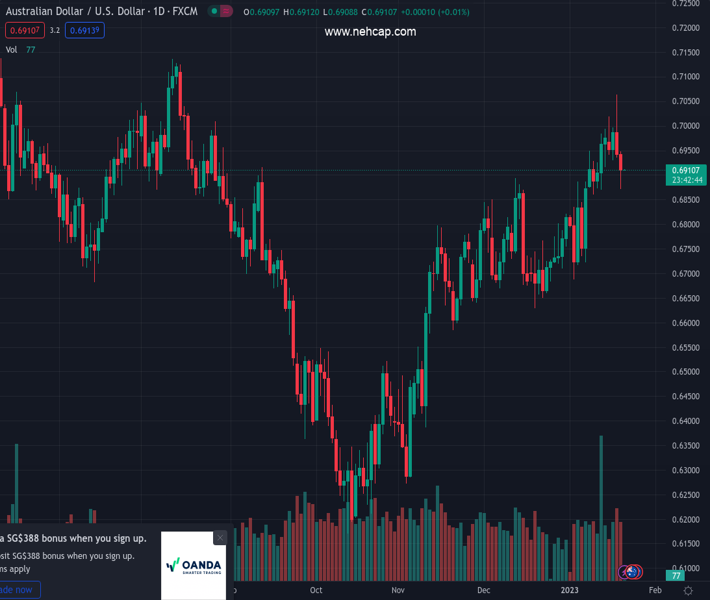
#AUDUSD @ 0.69113 stays pressured after two-day losing streak, braces for the first negative week in five. (Pivot Orderbook analysis)
…
This is a premium post.
[s2If !current_user_can(access_s2member_level4)]Please register for PREMIUM VERSION HERE to read full post below containing analysis. In case of any error or you think you are not able to read the full post below, please email us at support#nehcap.com [lwa][/s2If] [s2If current_user_can(access_s2member_level4)]
- AUD/USD stays pressured after two-day losing streak, braces for the first negative week in five.
- Downbeat Aussie data, mixed statistics in the US keep recession woes on the table.
- Policymakers at Fed, ECB defend hawkish bias while citing inflation fears.
- Final round of Federal Reserve talks ahead of pre-meeting blackout appears crucial amid light calendar.
The pair currently trades last at 0.69113.
The previous day high was 0.7064 while the previous day low was 0.6936. The daily 38.2% Fib levels comes at 0.6985, expected to provide resistance. Similarly, the daily 61.8% fib level is at 0.7015, expected to provide resistance.
AUD/USD justifies its risk-barometer status, as well as bears the burden of downbeat statistics at home, as it holds lower ground near 0.6900 after declining for the last two consecutive days. In doing so, the Aussie pair braces for the first negative weekly closing in five while keeping the reversal from the highest levels since August.
On Thursday, Australia’s Consumer Inflation Expectations for January improved to 5.6% versus 5.2%. However, the employment numbers for December disappointed the AUD/USD pair traders afterward as the headline Employment Change turned negative on a seasonally adjusted basis, printing a -14.6K figure versus 22.5K expected and 64K prior. Further, the Unemployment Rate also rose to 3.5% compared to the market consensus of witnessing no change in the 3.4% previous readings.
On the other hand, US Unemployment Claims dropped to the lowest levels since late April 2022, to 190K for the week ended on January 13 versus 214K expected and 205K prior. Further, the Philadelphia Fed Manufacturing Survey Index improved to -8.9 for January compared to -11.0 market forecasts and -13.7 previous readings. Alternatively, US Building Permits eased in December to 1.33M MoM versus 1.37M consensus and 1.351M prior while the Housing Starts also dropped to 1.382M during the stated month from 1.401M in November, versus 1.359M expected.
It’s worth noting that the downbeat US Retail Sales and Producer Price Index (PPI) raised fears of an economic slowdown in the world’s largest economy after the softer wage growth and activity data flashed earlier.
Elsewhere, Federal Reserve Vice Chair Lael Brainard said that it will take time and resolve to get high inflation down to the fed’s 2% target. The policymaker also added, “The policy will need to be sufficiently restrictive for some time.” On the same line, Boston Fed President Collins signaled that the baseline remains that the effective fed funds rate should settle slightly above 5.0%, implying three more 25bp rate rises. The same view was shared by most Fed speakers as they sneak into the pre-FOMC blackout period from this Saturday.
Amid these plays, Wall Street closed negative while the yields bounced off multi-day low but the US Dollar struggled to improve.
Moving on, a lack of major data/events highlights Fedspeak as the key catalyst.
Rising wedge confirmation favors the AUD/USD bears. That said, the monthly support line near 0.6835 appears the immediate target for sellers.
Technical Levels: Supports and Resistances
AUDUSD currently trading at 0.691 at the time of writing. Pair opened at 0.6936 and is trading with a change of -0.37% % .
| Overview | Overview.1 | |
|---|---|---|
| 0 | Today last price | 0.691 |
| 1 | Today Daily Change | -0.0026 |
| 2 | Today Daily Change % | -0.37% |
| 3 | Today daily open | 0.6936 |
The pair remains strongly bullish on the daily timeframe. It trades above its 20 SMA @ 0.6835, 50 SMA 0.6769, 100 SMA @ 0.6638 and 200 SMA @ 0.6824.
| Trends | Trends.1 | |
|---|---|---|
| 0 | Daily SMA20 | 0.6835 |
| 1 | Daily SMA50 | 0.6769 |
| 2 | Daily SMA100 | 0.6638 |
| 3 | Daily SMA200 | 0.6824 |
The previous day high was 0.7064 while the previous day low was 0.6936. The daily 38.2% Fib levels comes at 0.6985, expected to provide resistance. Similarly, the daily 61.8% fib level is at 0.7015, expected to provide resistance.
Note the levels of interest below:
- Pivot support is noted at 0.6893, 0.685, 0.6765
- Pivot resistance is noted at 0.7022, 0.7107, 0.715
| Levels | Levels.1 |
|---|---|
| Previous Daily High | 0.7064 |
| Previous Daily Low | 0.6936 |
| Previous Weekly High | 0.6994 |
| Previous Weekly Low | 0.6860 |
| Previous Monthly High | 0.6893 |
| Previous Monthly Low | 0.6629 |
| Daily Fibonacci 38.2% | 0.6985 |
| Daily Fibonacci 61.8% | 0.7015 |
| Daily Pivot Point S1 | 0.6893 |
| Daily Pivot Point S2 | 0.6850 |
| Daily Pivot Point S3 | 0.6765 |
| Daily Pivot Point R1 | 0.7022 |
| Daily Pivot Point R2 | 0.7107 |
| Daily Pivot Point R3 | 0.7150 |
[/s2If]
Join Our Telegram Group
")


