#AUDUSD @ 0.68979 failed to gain traction on rising US recession fears and poor Ausslie’s employment data. (Pivot Orderbook analysis)
…
This is a premium post.
[s2If !current_user_can(access_s2member_level4)]Please register for PREMIUM VERSION HERE to read full post below containing analysis. In case of any error or you think you are not able to read the full post below, please email us at support#nehcap.com [lwa][/s2If] [s2If current_user_can(access_s2member_level4)]
- AUD/USD failed to gain traction on rising US recession fears and poor Ausslie’s employment data.
- US Initial Jobless Claims were better than expected, cushioning the US Dollar fall.
- RBA’s odds for a rate hike lie around 60%, while 40% expects no change to its monetary policy.
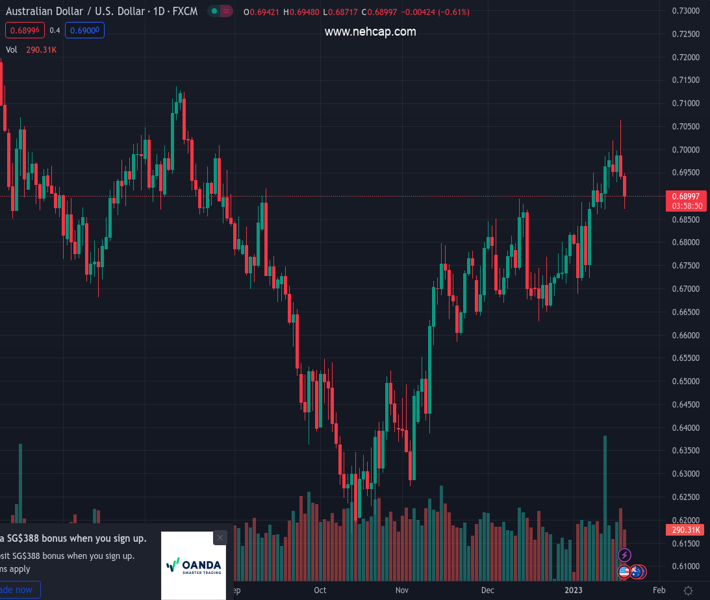
The pair currently trades last at 0.68979.
The previous day high was 0.7064 while the previous day low was 0.6936. The daily 38.2% Fib levels comes at 0.6985, expected to provide resistance. Similarly, the daily 61.8% fib level is at 0.7015, expected to provide resistance.
AUD/USD slides for the second consecutive day, registering a new weekly low of 0.6871 due to a risk-off impulse spurred by recession worries mounting after US economic data, indeed showed the economy is slowing. Hawkish Fed commentary spooked investors, who flew to safety. At the time of writing, the AUD/USD is trading at 0.6901, below its opening price by 0.61%.
The AUD/USD continues to weaken, even though the US Dollar (USD), remains offered across the board. Wednesday’s inflation data in the United States (US) cooled down, reflecting the tightening monetary conditions imposed by the US Federal Reserve (Fed). However, consumers are feeling the effects, as Retail Sales plunged on a monthly basis, while Industrial Production (IP) fell for the second straight month.
Thursday’s US economic docket witnessed unemployment claims rising by 190,000, 24,000 below expectations, while the Continuing Claims edged lower. At the same time, Housing Starts and Building Permits missed estimates, while the Philadelphia Fed Manufacturing Index, although in contractionary territory at -8.9, improved compared to November’s -13.7 reading.
The US Dollar Index, a measure of the buck against a basket of peers, extended its losses for two straight days, sliding 0.24% to 102.165. Nevertheless, a late recovery in US Treasury yields, namely the 10-year bond rate, climbs four bps at 3.411%, a headwind for the AUD/USD.
On the Australian side, employment figures unexpectedly fell in December, a headwind for the Aussie (AUD). Money market futures imply a 60% probability for the Reserve Bank of Australia (RBA) to lift rates in February, but there’s also a 40% chance the RBA will pause, given rates have risen by 300 bps.
An absent Australian economic docket will leave AUD/USD traders leaning on US Dollar dynamics. The US calendar will feature Existing Home Sales alongside Fed speaking.
Technical Levels: Supports and Resistances
AUDUSD currently trading at 0.6898 at the time of writing. Pair opened at 0.6936 and is trading with a change of -0.55 % .
| Overview | Overview.1 | |
|---|---|---|
| 0 | Today last price | 0.6898 |
| 1 | Today Daily Change | -0.0038 |
| 2 | Today Daily Change % | -0.5500 |
| 3 | Today daily open | 0.6936 |
The pair remains strongly bullish on the daily timeframe. It trades above its 20 SMA @ 0.6835, 50 SMA 0.6769, 100 SMA @ 0.6638 and 200 SMA @ 0.6824.
| Trends | Trends.1 | |
|---|---|---|
| 0 | Daily SMA20 | 0.6835 |
| 1 | Daily SMA50 | 0.6769 |
| 2 | Daily SMA100 | 0.6638 |
| 3 | Daily SMA200 | 0.6824 |
The previous day high was 0.7064 while the previous day low was 0.6936. The daily 38.2% Fib levels comes at 0.6985, expected to provide resistance. Similarly, the daily 61.8% fib level is at 0.7015, expected to provide resistance.
Note the levels of interest below:
- Pivot support is noted at 0.6893, 0.685, 0.6765
- Pivot resistance is noted at 0.7022, 0.7107, 0.715
| Levels | Levels.1 |
|---|---|
| Previous Daily High | 0.7064 |
| Previous Daily Low | 0.6936 |
| Previous Weekly High | 0.6994 |
| Previous Weekly Low | 0.6860 |
| Previous Monthly High | 0.6893 |
| Previous Monthly Low | 0.6629 |
| Daily Fibonacci 38.2% | 0.6985 |
| Daily Fibonacci 61.8% | 0.7015 |
| Daily Pivot Point S1 | 0.6893 |
| Daily Pivot Point S2 | 0.6850 |
| Daily Pivot Point S3 | 0.6765 |
| Daily Pivot Point R1 | 0.7022 |
| Daily Pivot Point R2 | 0.7107 |
| Daily Pivot Point R3 | 0.7150 |
[/s2If]
Join Our Telegram Group
")


