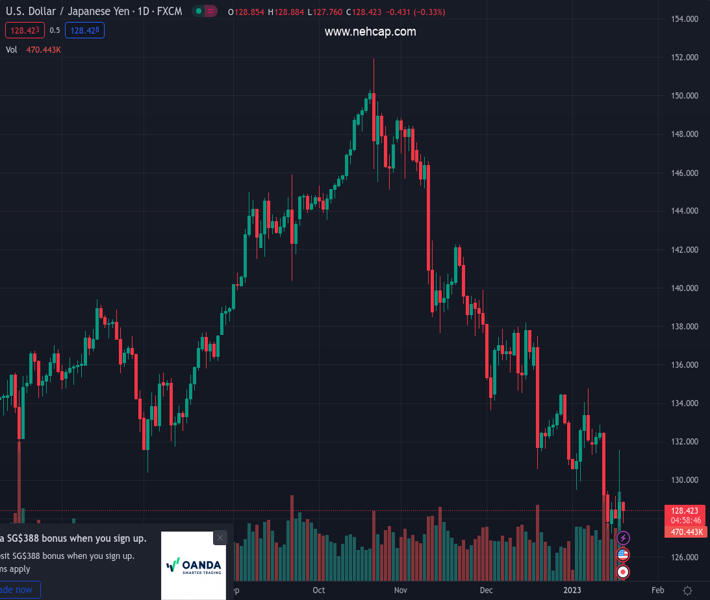
#USDJPY @ 128.500 The daily chart is bearish biased, though it remains unable to extend its losses beneath 128.00 (Pivot Orderbook analysis)
…
This is a premium post.
[s2If !current_user_can(access_s2member_level4)]Please register for PREMIUM VERSION HERE to read full post below containing analysis. In case of any error or you think you are not able to read the full post below, please email us at support#nehcap.com [lwa][/s2If] [s2If current_user_can(access_s2member_level4)]
- The USD/JPY daily chart is bearish biased, though it remains unable to extend its losses beneath 128.00
- The USD/JPY is trading sideways in the near term, awaiting a break above/below 129.00/128.00.
The pair currently trades last at 128.500.
The previous day high was 131.58 while the previous day low was 127.57. The daily 38.2% Fib levels comes at 130.05, expected to provide resistance. Similarly, the daily 61.8% fib level is at 129.1, expected to provide resistance.
On Thursday, the USD/JPY fails to hold to its gains and trades beneath its opening price by 0.33% after hitting a daily high of 128.88. At the time of writing, the USD/JPY exchanges hand at 128.40, amidst a risk-off impulse and a soft US Dollar (USD).
Failure to crack the 20-day Exponential Moving Average (EMA) at 131.13 exposed the USD/JPY to selling pressure. In addition, price action dived back below a three-month-old downslope resistance trendline, which tracks the USD/JPY downtrend. Therefore, the path of least resistance is downwards, but a decisive break below the YTD low of 127.21 is needed, so the USD/JPY might get poised towards the May 24 daily low of 126.36.
Short term, the USD/JPY 4-hour chart suggests the pair as range bound, although the Relative Strength Index (RSI) is at bearish territory. The Rate of Change (RoC) shows buyers gathering momentum. Hence, mixed signals surrounding the USD/JPY pair might refrain traders from opening fresh positions unless a decisive break is achieved.
The USD/JPY key resistance levels are 129.00, the daily pivot at 129.33, and the 50-EMA at 129.60. On the other hand, the USD/JPY first support would be 128.00, followed by the January 18 daily low of 127.55, ahead of 127.00.
Technical Levels: Supports and Resistances
USDJPY currently trading at 128.49 at the time of writing. Pair opened at 128.87 and is trading with a change of -0.29 % .
| Overview | Overview.1 | |
|---|---|---|
| 0 | Today last price | 128.49 |
| 1 | Today Daily Change | -0.38 |
| 2 | Today Daily Change % | -0.29 |
| 3 | Today daily open | 128.87 |
The pair remains strongly bearish on the daily time frame. It trades below the 20 SMA @ 131.48, 50 SMA 135.24, 100 SMA @ 140.32 and 200 SMA @ 136.68.
| Trends | Trends.1 | |
|---|---|---|
| 0 | Daily SMA20 | 131.48 |
| 1 | Daily SMA50 | 135.24 |
| 2 | Daily SMA100 | 140.32 |
| 3 | Daily SMA200 | 136.68 |
The previous day high was 131.58 while the previous day low was 127.57. The daily 38.2% Fib levels comes at 130.05, expected to provide resistance. Similarly, the daily 61.8% fib level is at 129.1, expected to provide resistance.
Note the levels of interest below:
- Pivot support is noted at 127.1, 125.33, 123.08
- Pivot resistance is noted at 131.11, 133.35, 135.12
| Levels | Levels.1 |
|---|---|
| Previous Daily High | 131.58 |
| Previous Daily Low | 127.57 |
| Previous Weekly High | 132.87 |
| Previous Weekly Low | 127.46 |
| Previous Monthly High | 138.18 |
| Previous Monthly Low | 130.57 |
| Daily Fibonacci 38.2% | 130.05 |
| Daily Fibonacci 61.8% | 129.10 |
| Daily Pivot Point S1 | 127.10 |
| Daily Pivot Point S2 | 125.33 |
| Daily Pivot Point S3 | 123.08 |
| Daily Pivot Point R1 | 131.11 |
| Daily Pivot Point R2 | 133.35 |
| Daily Pivot Point R3 | 135.12 |
[/s2If]
Join Our Telegram Group
")


