WTI price continues to lose ground for the second successive session on Monday. (Pivot Orderbook analysis)
…
This is a premium post.
[s2If !current_user_can(access_s2member_level4)]Please register for FREE REGISTER to read full post below containing analysis. In case of any error or you think you are not able to read the full post below, please email us at support#nehcap.com [lwa][/s2If] [s2If current_user_can(access_s2member_level1)]
- WTI price continues to lose ground for the second successive session on Monday.
- Crude oil prices receive downward pressure due to uncertainties over Crude oil demand globally.
- Higher interest rates globally dampen economic activities, which in turn undermines the consumption of oil.
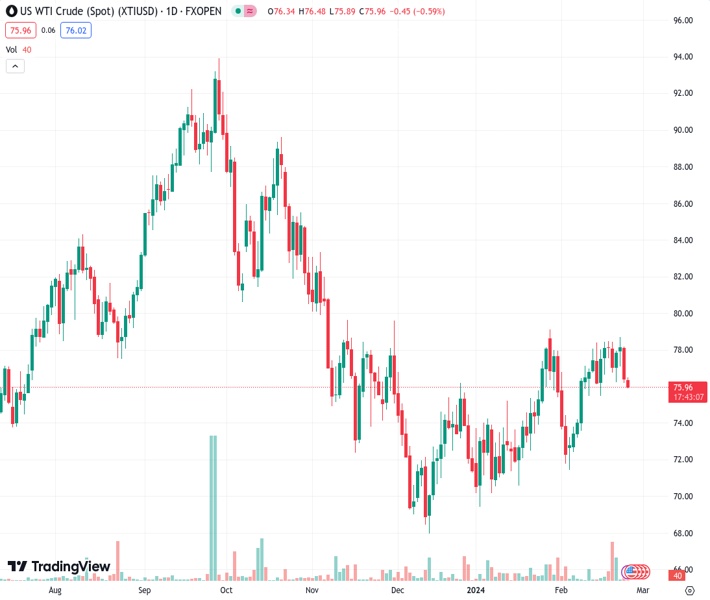
The pair currently trades last at 75.95.
The previous day high was 78.3 while the previous day low was 76.22. The daily 38.2% Fib levels comes at 77.02, expected to provide resistance. Similarly, the daily 61.8% fib level is at 77.51, expected to provide resistance.
West Texas Intermediate (WTI) oil prices extend their decline for the second consecutive session, hovering near $76.00 per barrel during the Asian trading session on Monday. The downward pressure on Crude oil prices can be attributed to uncertainties surrounding demand, likely influenced by heightened global risk sentiment. This sentiment could prompt central banks to adopt a patient stance regarding the trajectory of interest rates.
The global trend of higher interest rates is dampening economic activities, thereby reducing the consumption of Crude oil and resulting in lower demand. The recent Federal Open Market Committee (FOMC) Minutes highlighted concerns about interest rate cuts, signaling a preference for maintaining higher borrowing costs to combat persistent inflationary pressures. This stance has contributed to the moderation in oil prices.
Furthermore, hawkish remarks from officials at the Federal Reserve (Fed) have signaled a continuation of higher Fed rates. John C. Williams, President of the New York Federal Reserve, suggested in an interview that rate cuts might be possible later in the year, but emphasized that they would only be implemented if deemed appropriate. Similarly, Federal Reserve Governor Christopher J. Waller has proposed delaying any rate cuts for a few months to assess whether January’s high inflation report was an anomaly.
The escalation of geopolitical tensions in the Middle East has sparked concerns regarding possible disruptions to the oil supply. However, despite these concerns, significant supply constraints have not yet materialized. In addition, White House national security adviser Jake Sullivan announced on Sunday that negotiators from the United States, Egypt, Qatar, and Israel had reached a preliminary agreement on a hostage deal during discussions in Paris.
Technical Levels: Supports and Resistances
XTIUSD currently trading at 75.95 at the time of writing. Pair opened at 76.47 and is trading with a change of -0.68 % .
| Overview | Overview.1 | |
|---|---|---|
| 0 | Today last price | 75.95 |
| 1 | Today Daily Change | -0.52 |
| 2 | Today Daily Change % | -0.68 |
| 3 | Today daily open | 76.47 |
The pair is trading below its 20 Daily moving average @ 76.22, above its 50 Daily moving average @ 74.51 , below its 100 Daily moving average @ 76.56 and below its 200 Daily moving average @ 77.6
| Trends | Trends.1 | |
|---|---|---|
| 0 | Daily SMA20 | 76.22 |
| 1 | Daily SMA50 | 74.51 |
| 2 | Daily SMA100 | 76.56 |
| 3 | Daily SMA200 | 77.60 |
The previous day high was 78.3 while the previous day low was 76.22. The daily 38.2% Fib levels comes at 77.02, expected to provide resistance. Similarly, the daily 61.8% fib level is at 77.51, expected to provide resistance.
Note the levels of interest below:
- Pivot support is noted at 75.69, 74.91, 73.61
- Pivot resistance is noted at 77.77, 79.08, 79.85
| Levels | Levels.1 |
|---|---|
| Previous Daily High | 78.30 |
| Previous Daily Low | 76.22 |
| Previous Weekly High | 78.74 |
| Previous Weekly Low | 76.22 |
| Previous Monthly High | 79.19 |
| Previous Monthly Low | 69.41 |
| Daily Fibonacci 38.2% | 77.02 |
| Daily Fibonacci 61.8% | 77.51 |
| Daily Pivot Point S1 | 75.69 |
| Daily Pivot Point S2 | 74.91 |
| Daily Pivot Point S3 | 73.61 |
| Daily Pivot Point R1 | 77.77 |
| Daily Pivot Point R2 | 79.08 |
| Daily Pivot Point R3 | 79.85 |
[/s2If]
Nehcap Trading Strategies
The NEHCAP currently runs the following trading systems for clients. They can be bought and run on your funds.
The system is trading live: LIVE ACCOUNT TRACKING
Contact Us: Contact
The HFT_FIX can be run free for 2 weeks on any broker with a ECN. Apply for a free trial
Join Our Telegram Group
")


