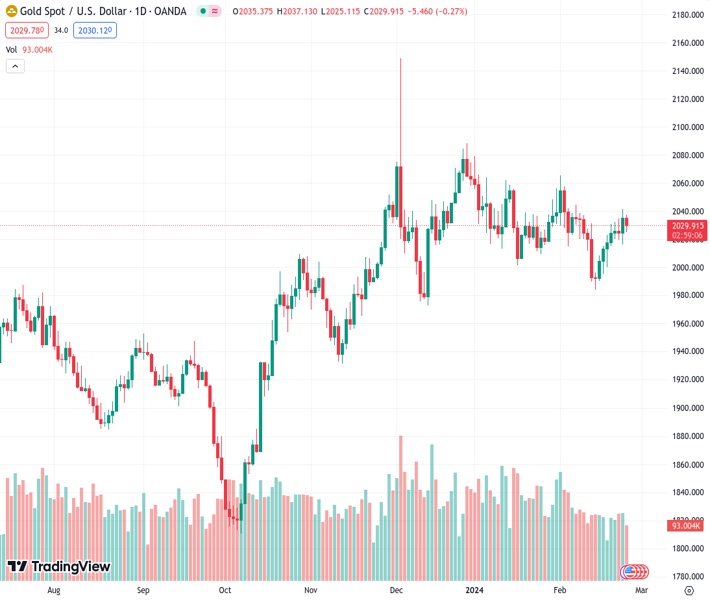
Gold retreats to $2,026.93, facing pressure from a strengthening US Dollar and Treasury yield uptick.
…
This is a premium post.
[s2If !current_user_can(access_s2member_level4)]Please register for FREE REGISTER to read full post below containing analysis. In case of any error or you think you are not able to read the full post below, please email us at support#nehcap.com [lwa][/s2If] [s2If current_user_can(access_s2member_level1)]
- Gold retreats to $2,026.93, facing pressure from a strengthening US Dollar and Treasury yield uptick.
- Market reevaluates Fed rate cut timeline with June odds at 50% for a potential easing.
- The US 10-year Treasury yield hovering around YTD highs keeps Gold’s price capped.
Gold price retraces after hitting the 50-day Simple Moving Average (SMA) at $2,033.67 during the European session and is down 0.40% as the Greenback (USD) dives. However, a rise in the US 10-year Treasury yield and traders trimming their odds of a dovish US Federal Reserve (Fed) sponsored a leg down in the non-yielding metal. The XAU/USD trades at $2,026.93 after hitting a high of $2,037.07.
Sentiment remains mixed, though tilted slightly negative, favoring the US Dollar. Interest rate speculators have priced out a Fed rate cut in March and May. For June, the odds of a quarter of a percentage point rate cut are at 50%. The US 10-year Treasury note climbs four-and-a-half basis points to 4.295%, shy of reaching the year-to-date (YTD) high of 4.354%, though keeping the yellow metal pressured, as investors align themselves with Fed officials’ posture of three rate cuts toward the end of 2024.
Monday sees a repeat of Friday’s note: “Gold has shifted to a neutral-upwards bias as it hurdles the 50-day Simple Moving Average (SMA).”
Even though XAU/USD has failed to cling above the 50-day SMA, the bias is intact unless Gold falls below the February 16 swing low of $2,016.15, which would exacerbate a challenge of the October 27 daily high-turned-support at $2,009.42. Once cleared, that will expose key technical support levels, like the 100-day SMA at $2,007.82, followed by the 200-day SMA at $1,966.79.
On the flip side, buyers dragging the XAU/USD spot price above the 50-day SMA could pave the way to challenge the $2,050 figure. Once those levels are cleared, up next would be the February 1 high at $2,065.60, ahead of the December 28 high at $2,088.48.
[/s2If]
Nehcap Trading Strategies
The NEHCAP currently runs the following trading systems for clients. They can be bought and run on your funds.
The system is trading live: LIVE ACCOUNT TRACKING
Contact Us: Contact
The HFT_FIX can be run free for 2 weeks on any broker with a ECN. Apply for a free trial
Join Our Telegram Group
")


