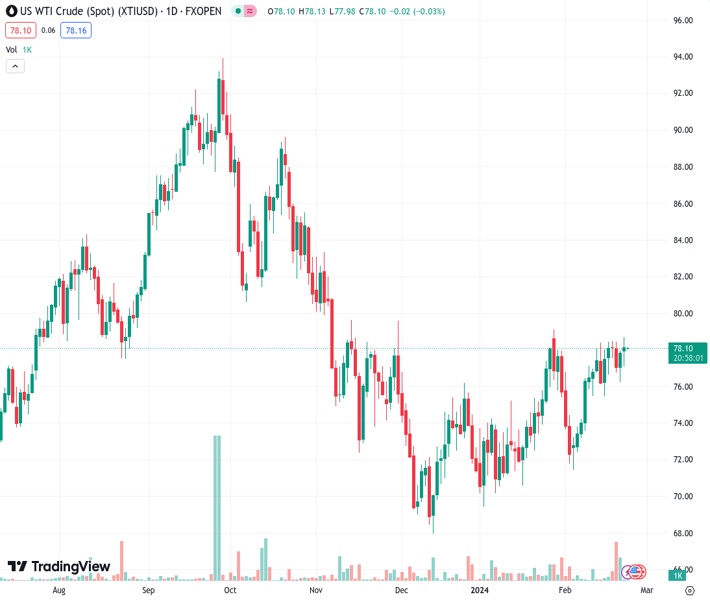
WTI hovers around $78.00 in Friday’s early Asian session. (Pivot Orderbook analysis)
…
This is a premium post.
[s2If !current_user_can(access_s2member_level4)]Please register for FREE REGISTER to read full post below containing analysis. In case of any error or you think you are not able to read the full post below, please email us at support#nehcap.com [lwa][/s2If] [s2If current_user_can(access_s2member_level1)]
- WTI hovers around $78.00 in Friday’s early Asian session.
- Crude oil inventory increased by 3.514 million barrels last week, below forecasts.
- The ‘higher for longer’ interest rate narrative from major central banks might cap the upside of WTI.
The pair currently trades last at 78.03.
The previous day high was 78.74 while the previous day low was 77.09. The daily 38.2% Fib levels comes at 78.11, expected to provide resistance. Similarly, the daily 61.8% fib level is at 77.72, expected to provide support.
Western Texas Intermediate (WTI), the US crude oil benchmark, is trading around $78.00 on Friday. WTI prices edge higher as the EIA Crude Oil stockpiles report came in just below forecasts and the geopolitical tensions in the Middle East remain uncertain.
Crude oil inventory increased by 3.514 million barrels for the week ending February 16 from the previous week’s 12 million barrel gains, the Energy Information Administration reported on Thursday.
Israel has carried out several attacks against Hezbollah targets in Lebanon in recent days, while Houthi militants in Yemen continue to attack ships in the Red Sea. The ongoing geopolitical tensions in the Middle East raise concern about the disruption in crude supplies, which supports WTI prices for the time being.
On the other hand, the possibility that the US Federal Reserve (Fed) and major central banks will maintain the ‘higher for longer’ interest rate narrative might cap the upside of WTI prices. The FOMC Minutes at its January meeting showed that the Fed officials wanted to see more evidence before beginning to cut rates while warning about the “risks of moving too quickly” on cuts. It’s worth noting that higher interest rates might drag WTI prices lower, as it translates to less demand for oil with higher costs and slowing the economy.
Oil traders will keep an eye on the German Gross Domestic Product for the fourth quarter (Q4) and Fed Christopher J. Waller’s speech on Friday. The US Gross Domestic Product Annualized (GDP) for Q4 will be released next week. These events could significantly impact the USD-denominated WTI price. Oil traders will take cues from the data and find trading opportunities around WTI prices.
Technical Levels: Supports and Resistances
XTIUSD currently trading at 78.03 at the time of writing. Pair opened at 78.27 and is trading with a change of -0.31 % .
| Overview | Overview.1 | |
|---|---|---|
| 0 | Today last price | 78.03 |
| 1 | Today Daily Change | -0.24 |
| 2 | Today Daily Change % | -0.31 |
| 3 | Today daily open | 78.27 |
The pair remains strongly bullish on the daily timeframe. It trades above its 20 SMA @ 76.3, 50 SMA 74.42, 100 SMA @ 76.61 and 200 SMA @ 77.58.
| Trends | Trends.1 | |
|---|---|---|
| 0 | Daily SMA20 | 76.30 |
| 1 | Daily SMA50 | 74.42 |
| 2 | Daily SMA100 | 76.61 |
| 3 | Daily SMA200 | 77.58 |
The previous day high was 78.74 while the previous day low was 77.09. The daily 38.2% Fib levels comes at 78.11, expected to provide resistance. Similarly, the daily 61.8% fib level is at 77.72, expected to provide support.
Note the levels of interest below:
- Pivot support is noted at 77.33, 76.38, 75.68
- Pivot resistance is noted at 78.98, 79.68, 80.63
| Levels | Levels.1 |
|---|---|
| Previous Daily High | 78.74 |
| Previous Daily Low | 77.09 |
| Previous Weekly High | 78.47 |
| Previous Weekly Low | 75.51 |
| Previous Monthly High | 79.19 |
| Previous Monthly Low | 69.41 |
| Daily Fibonacci 38.2% | 78.11 |
| Daily Fibonacci 61.8% | 77.72 |
| Daily Pivot Point S1 | 77.33 |
| Daily Pivot Point S2 | 76.38 |
| Daily Pivot Point S3 | 75.68 |
| Daily Pivot Point R1 | 78.98 |
| Daily Pivot Point R2 | 79.68 |
| Daily Pivot Point R3 | 80.63 |
[/s2If]
Nehcap Trading Strategies
The NEHCAP currently runs the following trading systems for clients. They can be bought and run on your funds.
The system is trading live: LIVE ACCOUNT TRACKING
Contact Us: Contact
The HFT_FIX can be run free for 2 weeks on any broker with a ECN. Apply for a free trial
Join Our Telegram Group
")


