WTI comes under some selling pressure on Friday and snaps a two-day winning streak. (Pivot Orderbook analysis)
…
This is a premium post.
[s2If !current_user_can(access_s2member_level4)]Please register for FREE REGISTER to read full post below containing analysis. In case of any error or you think you are not able to read the full post below, please email us at support#nehcap.com [lwa][/s2If] [s2If current_user_can(access_s2member_level1)]
- WTI comes under some selling pressure on Friday and snaps a two-day winning streak.
- Concerns about slowing global demand exert downward pressure on the black liquid.
- Worries about supply disruptions in the Middle East should help limit deeper losses.
The pair currently trades last at 77.51.
The previous day high was 78.74 while the previous day low was 77.09. The daily 38.2% Fib levels comes at 78.11, expected to provide resistance. Similarly, the daily 61.8% fib level is at 77.72, expected to provide resistance.
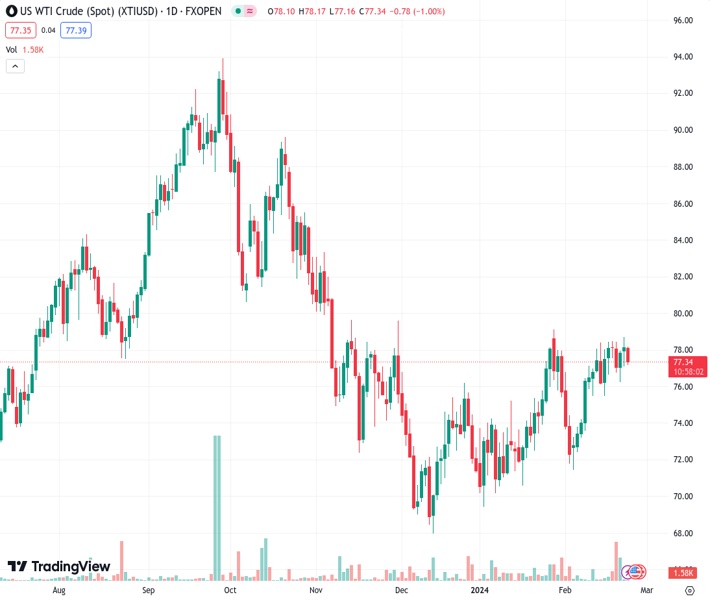
West Texas Intermediate (WTI) US Crude Oil prices drift lower on the last day of the week and move away from a fresh monthly peak, around the $78.75 region touched on Thursday. The commodity remains depressed through the first half of the European session and currently trades near the daily low, around mid-$77.00s.
Investors remain concerned about the worsening economic conditions across the globe, especially after Japan and the UK entered a technical recession during the fourth quarter of 2023. Moreover, expectations that higher borrowing costs could hinder economic activity and dent fuel demand in the world’s largest oil consumer turn out to be key factors exerting downward pressure on Oil prices.
That said, signs of tightening global supplies, due to disruptions in the Middle East, might continue to underpin the commodity and help limit any meaningful corrective decline. In fact, the Israel-Hamas war has shown no signs of de-escalation yet, while attacks on commercial vessels by the Iran-aligned Houthi rebels in Yemen have raised worries about trade flow through the critical Red Sea waterway.
Meanwhile, the Energy Information Administration reported on Thursday that US Crude Oil inventory rose by 3.514 million barrels for the week to February 16, down sharply from a sizeable build of 12 million barrels previously. This reaffirms expectations that demand from the US refiners will improve after the recent outages and warrants caution before placing bearish bets around the black liquid.
Even from a technical perspective, Crude Oil prices have been oscillating in a familiar trading range over the past week or so. This points to indecision among traders over the next leg of a directional move. Nevertheless, the commodity remains on track to register modest weekly losses for the first time in the previous three.
Technical Levels: Supports and Resistances
XTIUSD currently trading at 77.51 at the time of writing. Pair opened at 78.27 and is trading with a change of -0.97 % .
| Overview | Overview.1 | |
|---|---|---|
| 0 | Today last price | 77.51 |
| 1 | Today Daily Change | -0.76 |
| 2 | Today Daily Change % | -0.97 |
| 3 | Today daily open | 78.27 |
The pair is trading above its 20 Daily moving average @ 76.3, above its 50 Daily moving average @ 74.42 , above its 100 Daily moving average @ 76.61 and below its 200 Daily moving average @ 77.58
| Trends | Trends.1 | |
|---|---|---|
| 0 | Daily SMA20 | 76.30 |
| 1 | Daily SMA50 | 74.42 |
| 2 | Daily SMA100 | 76.61 |
| 3 | Daily SMA200 | 77.58 |
The previous day high was 78.74 while the previous day low was 77.09. The daily 38.2% Fib levels comes at 78.11, expected to provide resistance. Similarly, the daily 61.8% fib level is at 77.72, expected to provide resistance.
Note the levels of interest below:
- Pivot support is noted at 77.33, 76.38, 75.68
- Pivot resistance is noted at 78.98, 79.68, 80.63
| Levels | Levels.1 |
|---|---|
| Previous Daily High | 78.74 |
| Previous Daily Low | 77.09 |
| Previous Weekly High | 78.47 |
| Previous Weekly Low | 75.51 |
| Previous Monthly High | 79.19 |
| Previous Monthly Low | 69.41 |
| Daily Fibonacci 38.2% | 78.11 |
| Daily Fibonacci 61.8% | 77.72 |
| Daily Pivot Point S1 | 77.33 |
| Daily Pivot Point S2 | 76.38 |
| Daily Pivot Point S3 | 75.68 |
| Daily Pivot Point R1 | 78.98 |
| Daily Pivot Point R2 | 79.68 |
| Daily Pivot Point R3 | 80.63 |
[/s2If]
Nehcap Trading Strategies
The NEHCAP currently runs the following trading systems for clients. They can be bought and run on your funds.
The system is trading live: LIVE ACCOUNT TRACKING
Contact Us: Contact
The HFT_FIX can be run free for 2 weeks on any broker with a ECN. Apply for a free trial
Join Our Telegram Group
")


