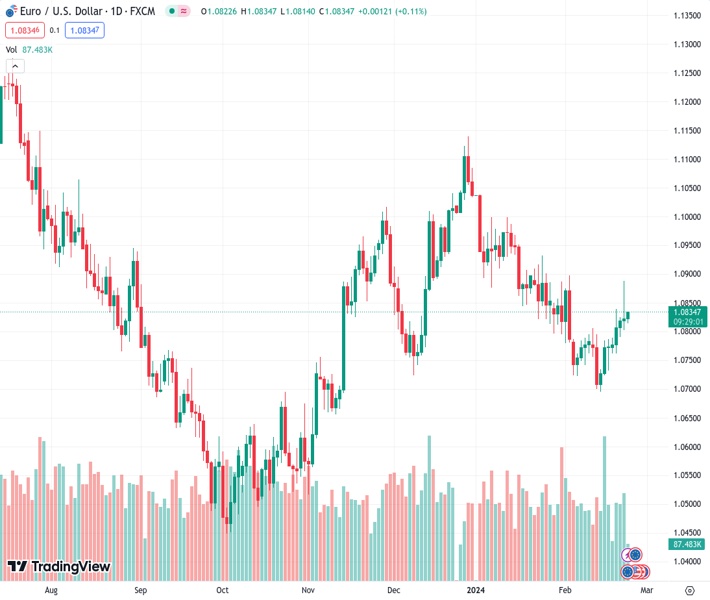
The US Dollar trades in the red on Friday, and for the week.
…
This is a premium post.
[s2If !current_user_can(access_s2member_level4)]Please register for FREE REGISTER to read full post below containing analysis. In case of any error or you think you are not able to read the full post below, please email us at support#nehcap.com [lwa][/s2If] [s2If current_user_can(access_s2member_level1)]
- The US Dollar trades in the red on Friday, and for the week.
- Market sentiment was very positive for equities, bearish for the US Dollar this week.
- The US Dollar Index falls below 104 again and selling pressure is visible on the charts.
The US Dollar (USD) is closing this week’s performance at a loss. A correlation with the risk sentiment and the fact that equities had a very upbeat week makes it clear that the US Dollar does not thrive when there is a risk on tone present in markets. With all three major US equity indices firmly higher for this week, the US Dollar Index is taking a step back and is set to close out the week lower.
On the economic data front, there is nearly nothing to report. Besides possibly a few surprise unscheduled comments from an US Federal Reserve member, it looks like markets will slowly head out into the weekend. Next week, nearly every day sees a pivotal number due to be released, with Durable Goods, US Gross Domestic Product, Personal Consumption Expenditures and Manufacturing data from the Institute of Supply Management all on the docket.
The US Dollar Index (DXY) is set to close this week in the red after a lacklustre performance. The Greenback was outmatched by the risk on sentiment that swept equity markets higher. Seeing the light calendar, it looks like not much movement will be taking place ahead of the weekend. Expect to see traders keep their powder dry for next week where almost every day a pivotal economic data number is set to move the needle.
To the upside, the 100-day Simple Moving Average (SMA) near 104.07 is the first level to watch as a support that has been turned into a resistance. Should the US Dollar jump to 105.00, 105.12 is a key level to keep an eye on. One step beyond there comes 105.88, the high of November 2023. Ultimately, 107.20 – the high of 2023 – could even come back into scope, but that would be when markets reprice the timing of a Fed rate cut again, delaying it to the last quarter of 2024.
The 200-day Simple Moving Average at 103.73 was broken on Thursday and should see more US Dollar bears flock in to trade the break for a weaker US Dollar. The 200-day SMA should not let go that easily, so a small retreat back to that level could be more than granted. Ultimately, it will lose its force with the ongoing selling pressure and could fall to 103.16 at the 55-day SMA.
[/s2If]
Nehcap Trading Strategies
The NEHCAP currently runs the following trading systems for clients. They can be bought and run on your funds.
The system is trading live: LIVE ACCOUNT TRACKING
Contact Us: Contact
The HFT_FIX can be run free for 2 weeks on any broker with a ECN. Apply for a free trial
Join Our Telegram Group
")


