Gold price is expected to close the week positively despite easing Fed early rate-cut hopes.
…
This is a premium post.
[s2If !current_user_can(access_s2member_level4)]Please register for FREE REGISTER to read full post below containing analysis. In case of any error or you think you are not able to read the full post below, please email us at support#nehcap.com [lwa][/s2If] [s2If current_user_can(access_s2member_level1)]
- Gold price is expected to close the week positively despite easing Fed early rate-cut hopes.
- The US Dollar falls despite the Fed sees rate cuts sometime in the second half of this year.
- Fed policymakers need more confidence before beginning to cut interest rates.
Gold price (XAU/USD) bounces back in Friday’s early New York session despite easing hopes of early rate cuts by the Federal Reserve (Fed). The precious metal recovers sharply while Fed policymakers are less convinced over inflation declining to the 2% target, which has improved the appeal of the US Dollar.
Fed policymakers are interested in holding interest rates in the range of 5.25%-5.50% for some more time to assess whether January’s sticky inflation data was a speedy bump or a pithole. The Fed seems not in a hurry to jump quickly on rate cuts as it could prompt upside risks to stubborn consumer price inflation.
The opportunity cost of holding non-yielding assets, such as Gold, increases when the Fed leans toward keeping interest rates higher for an extended period. Going forward, action in the safe-haven assets will be guided by market expectations for Fed rate cuts.
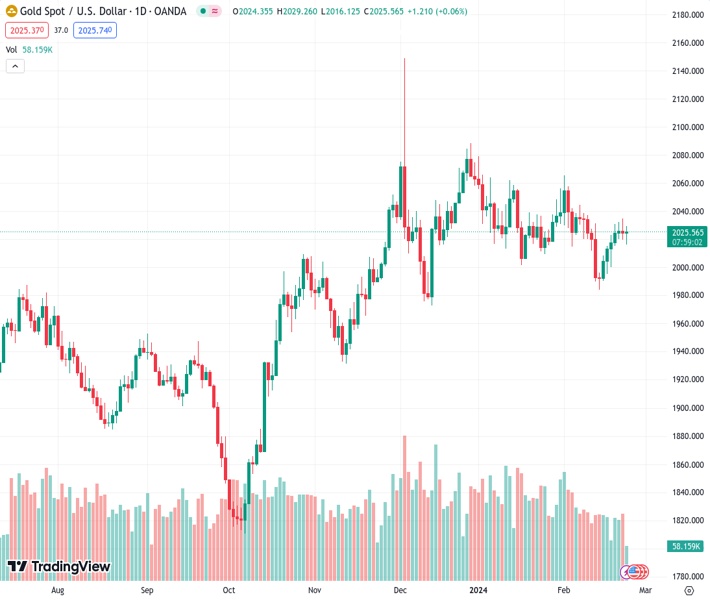
Gold price rebounds after sliding to a fresh two-day low below $2,020 as investors need fresh insights on the interest rate outlook. The near-term outlook remains sideways as the precious metal trades in a Symmetrical Triangle chart pattern.
The yellow metal falls after failing to test the downward-sloping border of the Symmetrical Triangle chart pattern formed on a daily time frame, which is plotted from the December 28 high at $2,088. The upward-sloping border of the aforementioned chart pattern is placed from the December 13 low at $1,973.
The triangle could break out in either direction. However, the odds marginally favor a move in the direction of the trend before the formation of the triangle – in this case up. A decisive break above or below the triangle boundary lines would indicate a breakout is underway.
The 14-period Relative Strength Index (RSI) oscillates in the 40.00-60.00 region, which indicates indecisiveness among investors.
[/s2If]
Nehcap Trading Strategies
The NEHCAP currently runs the following trading systems for clients. They can be bought and run on your funds.
The system is trading live: LIVE ACCOUNT TRACKING
Contact Us: Contact
The HFT_FIX can be run free for 2 weeks on any broker with a ECN. Apply for a free trial
Join Our Telegram Group
")


