Gold price generates more gains as Fed policymakers are confident that inflation is broadly declining.
…
This is a premium post.
[s2If !current_user_can(access_s2member_level4)]Please register for FREE REGISTER to read full post below containing analysis. In case of any error or you think you are not able to read the full post below, please email us at support#nehcap.com [lwa][/s2If] [s2If current_user_can(access_s2member_level1)]
- Gold price generates more gains as Fed policymakers are confident that inflation is broadly declining.
- The FOMC minutes for January policy will be a detailed explanation behind the Fed’s steady interest rate decision.
- Investors see the preliminary S&P Global Manufacturing PMI for February at 50.5.
Gold price (XAU/USD) extends its bullish streak for the fourth straight trading session on Tuesday. The outlook for the precious metal has strengthened as commentary from Federal Reserve (Fed) policymakers that inflation is broadly moving in the right direction has faded the impact of stubborn Consumer Price Index (CPI) and Producer Price Index (PPI) data for January.
The confidence of Fed policymakers that inflation is declining over the long term has trimmed the opportunity cost of holding non-yielding assets such as Gold. Meanwhile, investors await the Federal Reserve Open Market Committee (FOMC) minutes for the first monetary policy meeting of 2024. The FOMC minutes will provide cues about the timing of three rate-cuts, as forecasted by the Fed.
On the economic data front, preliminary S&P Global PMI data for February will guide the forward action in the Gold price and the US Dollar, which will be published on Thursday. The US Manufacturing PMI is expected to exceed the 50.0 threshold for the second straight month at 50.5. An upbeat factory data would have a negative impact on the Gold price.
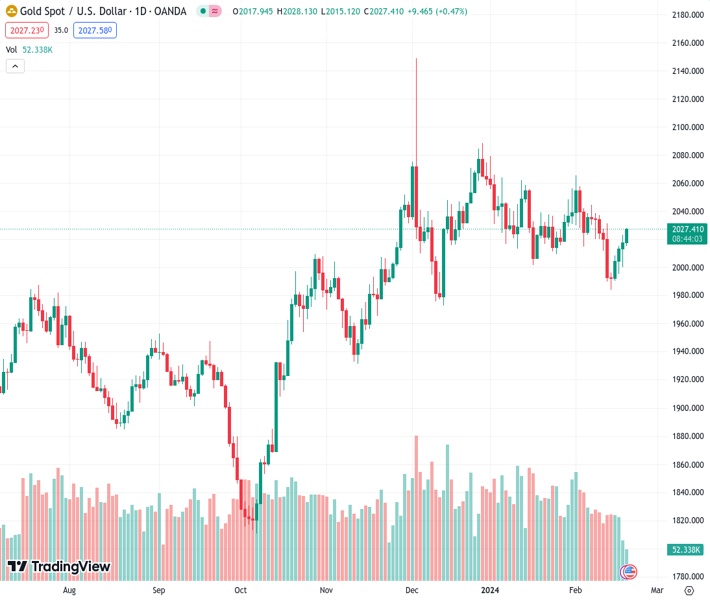
Gold price continues its winning spell for the fourth straight trading session. The precious metal attempts to deliver a decisive break above the 20 and 50-day Exponential Moving Averages (EMAs), which trade around $2,020.
The primary trend in the Gold price indicates indecisiveness among market participants due to a Symmetrical Triangle formation on a daily time frame. The upward and downward-sloping borders of the aforementioned chart pattern are plotted from December 13 low at $1,973 and December 28 high at $2,088, respectively.
The triangle could breakout in either direction, however, the odds marginally favor a move in the direction of the trend before the formation of the triangle – in this case up. A decisive break above or below the triangle boundary lines would indicate a breakout was underway.
The 14-period Relative Strength Index (RSI) has returned to the 40.00-60.00 range quickly after testing territory below 40.00, indicating a strong bullish reversal.
[/s2If]
Nehcap Trading Strategies
The NEHCAP currently runs the following trading systems for clients. They can be bought and run on your funds.
The system is trading live: LIVE ACCOUNT TRACKING
Contact Us: Contact
The HFT_FIX can be run free for 2 weeks on any broker with a ECN. Apply for a free trial
Join Our Telegram Group
")


