WTI remains under some selling pressure for the second straight day on Thursday. (Pivot Orderbook analysis)
…
This is a premium post.
[s2If !current_user_can(access_s2member_level4)]Please register for FREE REGISTER to read full post below containing analysis. In case of any error or you think you are not able to read the full post below, please email us at support#nehcap.com [lwa][/s2If] [s2If current_user_can(access_s2member_level1)]
- WTI remains under some selling pressure for the second straight day on Thursday.
- A spike in US inventories overshadows geopolitical risks and weighs on Oil prices.
- The OPEC sees a rise in global demand in 2024, 2025, albeit fails to lend support.
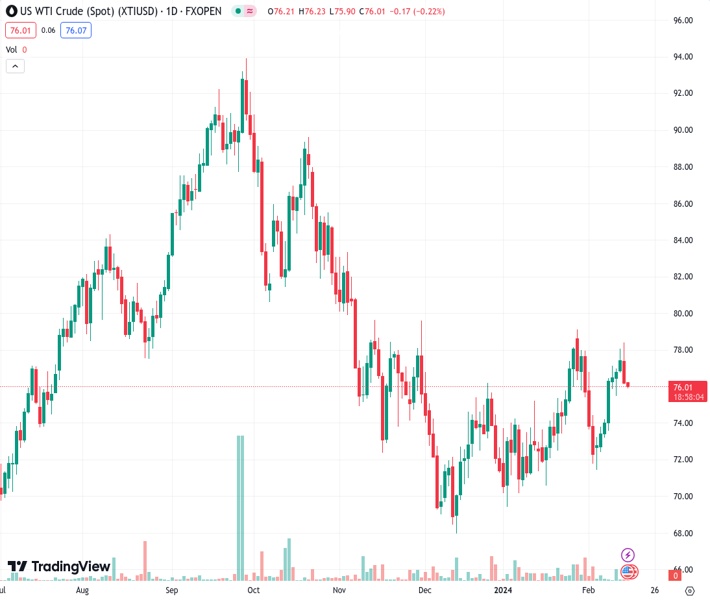
The pair currently trades last at 76.0.
The previous day high was 78.43 while the previous day low was 76.12. The daily 38.2% Fib levels comes at 77.0, expected to provide resistance. Similarly, the daily 61.8% fib level is at 77.55, expected to provide resistance.
West Texas Intermediate (WTI) US Crude Oil prices extend the overnight pullback from the vicinity of mid-$78.00s, or a fresh monthly peak and drift lower for the second successive day on Thursday. The commodity hovers around the $76.00 mark during the Asian session and remains well within the striking distance of the weekly low touched on Monday.
The larger-than-expected build in US Crude Oil inventories, to a larger extent, overshadows a combination of factors and exerts some pressure on the black liquid. The Energy Information Administration (EIA) said on Tuesday that US inventories rose by roughly 12 million barrels in the week ended February 9, well above market expectations amid a drop in refinery utilization to its lowest levels since December 2022.
Meanwhile, a monthly report from the Organization of the Petroleum Exporting Countries (OPEC), indicating that global Oil demand will rise by 2.25 million bpd in 2024 and by 1.85 million bpd in 2025, does little to impress bullish traders. Moreover, a fresh escalation of tension in the Middle East, which could disrupt supply from the oil-rich region, also fails to lend support to Crude Oil prices, favouring bearish traders.
In the latest development, Israel launched airstrikes in Lebanon in retaliation to a rocket fired into Northern Israel. This comes after Israeli Prime Minister Benjamin Netanyahu defied ceasefire calls from the international community and called a powerful operation in Rafa, raising the risk of a further escalation of military action in the region. The lack of buying interest, however, supports prospects for additional losses for Oil prices.
Market participants now look to the US economic docket, featuring the release of the Empire State Manufacturing Index, monthly Retail Sales figures, the Philly Fed Manufacturing Index and the usual Weekly Initial Jobless Claims. The data might influence the US Dollar (USD) price dynamics later during the early North American session and allow traders to grab short-term opportunities around Crude Oil prices.
Technical Levels: Supports and Resistances
XTIUSD currently trading at 76.0 at the time of writing. Pair opened at 76.33 and is trading with a change of -0.43 % .
| Overview | Overview.1 | |
|---|---|---|
| 0 | Today last price | 76.00 |
| 1 | Today Daily Change | -0.33 |
| 2 | Today Daily Change % | -0.43 |
| 3 | Today daily open | 76.33 |
The pair is trading above its 20 Daily moving average @ 75.4, above its 50 Daily moving average @ 73.55 , below its 100 Daily moving average @ 77.16 and below its 200 Daily moving average @ 77.38
| Trends | Trends.1 | |
|---|---|---|
| 0 | Daily SMA20 | 75.40 |
| 1 | Daily SMA50 | 73.55 |
| 2 | Daily SMA100 | 77.16 |
| 3 | Daily SMA200 | 77.38 |
The previous day high was 78.43 while the previous day low was 76.12. The daily 38.2% Fib levels comes at 77.0, expected to provide resistance. Similarly, the daily 61.8% fib level is at 77.55, expected to provide resistance.
Note the levels of interest below:
- Pivot support is noted at 75.49, 74.65, 73.18
- Pivot resistance is noted at 77.8, 79.27, 80.11
| Levels | Levels.1 |
|---|---|
| Previous Daily High | 78.43 |
| Previous Daily Low | 76.12 |
| Previous Weekly High | 77.18 |
| Previous Weekly Low | 71.46 |
| Previous Monthly High | 79.19 |
| Previous Monthly Low | 69.41 |
| Daily Fibonacci 38.2% | 77.00 |
| Daily Fibonacci 61.8% | 77.55 |
| Daily Pivot Point S1 | 75.49 |
| Daily Pivot Point S2 | 74.65 |
| Daily Pivot Point S3 | 73.18 |
| Daily Pivot Point R1 | 77.80 |
| Daily Pivot Point R2 | 79.27 |
| Daily Pivot Point R3 | 80.11 |
[/s2If]
Nehcap Trading Strategies
The NEHCAP currently runs the following trading systems for clients. They can be bought and run on your funds.
The system is trading live: LIVE ACCOUNT TRACKING
Contact Us: Contact
The HFT_FIX can be run free for 2 weeks on any broker with a ECN. Apply for a free trial
Join Our Telegram Group
")


