WTI price recovered its intraday losses due to escalated fear of supply disruption from the Middle East. (Pivot Orderbook analysis)
…
This is a premium post.
[s2If !current_user_can(access_s2member_level4)]Please register for FREE REGISTER to read full post below containing analysis. In case of any error or you think you are not able to read the full post below, please email us at support#nehcap.com [lwa][/s2If] [s2If current_user_can(access_s2member_level1)]
- WTI price recovered its intraday losses due to escalated fear of supply disruption from the Middle East.
- Crude oil prices faced a challenge of demand threat after the release of robust US CPI data.
- ANZ analysts worry about the OPEC’s adherence to its recent production cuts.
- API Weekly Crude Oil Stock surged by 8.52 million barrels for the week ending on February 5.
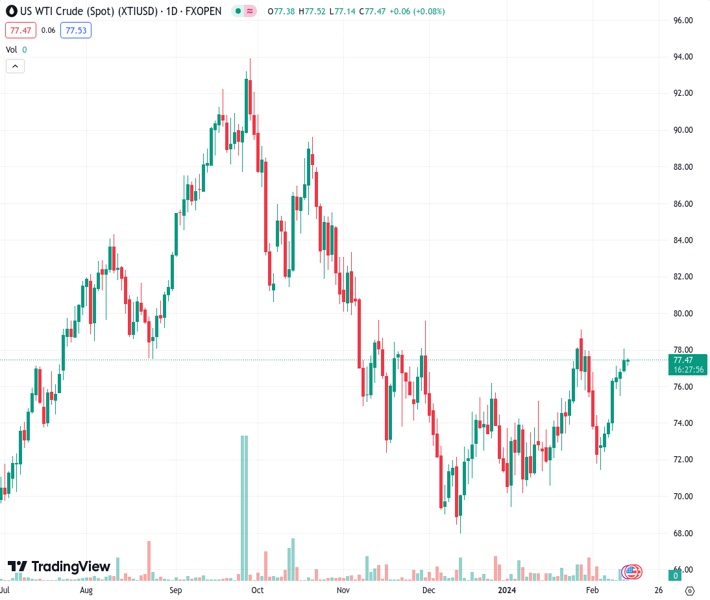
The pair currently trades last at 77.46.
The previous day high was 78.12 while the previous day low was 76.8. The daily 38.2% Fib levels comes at 77.61, expected to provide resistance. Similarly, the daily 61.8% fib level is at 77.3, expected to provide support.
West Texas Intermediate (WTI) oil price is on a path to resume its winning streak, trading around $77.50 per barrel during the Asian trading hours on Wednesday. Despite facing challenges, the price of Crude oil has recovered its intraday losses.
ANZ analysts attributed the weakening of oil prices partly to concerns about supply levels from members of the Organization of the Petroleum Exporting Countries (OPEC). According to OPEC’s monthly oil market report, there are worries about the group’s adherence to its recent production cuts. Notably, only Kuwait and Algeria have implemented their share of cuts, while Iraq’s output remains well above the agreed quota.
Additionally, Crude oil prices encountered resistance after the American Petroleum Institute (API) reported a significant increase in US crude inventories. According to the API Weekly Crude Oil Stock report, Crude inventories surged by 8.52 million barrels for the week ending on February 5, surpassing market expectations of a 2.6-million-barrel increase.
The unexpected upside surprise in US inflation data is exerting downward pressure on oil prices, as it implies the likelihood of higher interest rates in the United States persisting for an extended period, thereby dampening demand in the market.
In January, the US headline Consumer Price Index (CPI) came in at 3.1%, surpassing the anticipated 2.9% but slightly lower than the previous rate of 3.4%. Additionally, month-over-month inflation rose by 0.3%, contrary to the expectation of maintaining the previous reading of 0.2%.
The US Core CPI (YoY) remained unchanged at 3.9%, defying market expectations of a decline to 3.7% in January. Moreover, US Core Inflation (MoM) increased by 0.4%, surpassing the expected unchanged reading of 0.3% for January.
Investors are now eagerly awaiting the release of the US Energy Information Administration’s Crude Oil Stocks Change data for the week ending on February 9, with expectations of a decline in stockpiles of Crude oil and its derivatives in the United States.
Technical Levels: Supports and Resistances
XTIUSD currently trading at 77.46 at the time of writing. Pair opened at 77.49 and is trading with a change of -0.04 % .
| Overview | Overview.1 | |
|---|---|---|
| 0 | Today last price | 77.46 |
| 1 | Today Daily Change | -0.03 |
| 2 | Today Daily Change % | -0.04 |
| 3 | Today daily open | 77.49 |
The pair remains strongly bullish on the daily timeframe. It trades above its 20 SMA @ 75.22, 50 SMA 73.42, 100 SMA @ 77.32 and 200 SMA @ 77.36.
| Trends | Trends.1 | |
|---|---|---|
| 0 | Daily SMA20 | 75.22 |
| 1 | Daily SMA50 | 73.42 |
| 2 | Daily SMA100 | 77.32 |
| 3 | Daily SMA200 | 77.36 |
The previous day high was 78.12 while the previous day low was 76.8. The daily 38.2% Fib levels comes at 77.61, expected to provide resistance. Similarly, the daily 61.8% fib level is at 77.3, expected to provide support.
Note the levels of interest below:
- Pivot support is noted at 76.82, 76.15, 75.5
- Pivot resistance is noted at 78.13, 78.78, 79.45
| Levels | Levels.1 |
|---|---|
| Previous Daily High | 78.12 |
| Previous Daily Low | 76.80 |
| Previous Weekly High | 77.18 |
| Previous Weekly Low | 71.46 |
| Previous Monthly High | 79.19 |
| Previous Monthly Low | 69.41 |
| Daily Fibonacci 38.2% | 77.61 |
| Daily Fibonacci 61.8% | 77.30 |
| Daily Pivot Point S1 | 76.82 |
| Daily Pivot Point S2 | 76.15 |
| Daily Pivot Point S3 | 75.50 |
| Daily Pivot Point R1 | 78.13 |
| Daily Pivot Point R2 | 78.78 |
| Daily Pivot Point R3 | 79.45 |
[/s2If]
Nehcap Trading Strategies
The NEHCAP currently runs the following trading systems for clients. They can be bought and run on your funds.
The system is trading live: LIVE ACCOUNT TRACKING
Contact Us: Contact
The HFT_FIX can be run free for 2 weeks on any broker with a ECN. Apply for a free trial
Join Our Telegram Group
")


