WTI chalks in a seventh straight gain on Tuesday as geopolitical headlines remain. (Pivot Orderbook analysis)
…
This is a premium post.
[s2If !current_user_can(access_s2member_level4)]Please register for FREE REGISTER to read full post below containing analysis. In case of any error or you think you are not able to read the full post below, please email us at support#nehcap.com [lwa][/s2If] [s2If current_user_can(access_s2member_level1)]
- WTI chalks in a seventh straight gain on Tuesday as geopolitical headlines remain.
- A bumper US CPI inflation print keeps barrel prices capped.
- US API Weekly Crude Stocks surged once again.
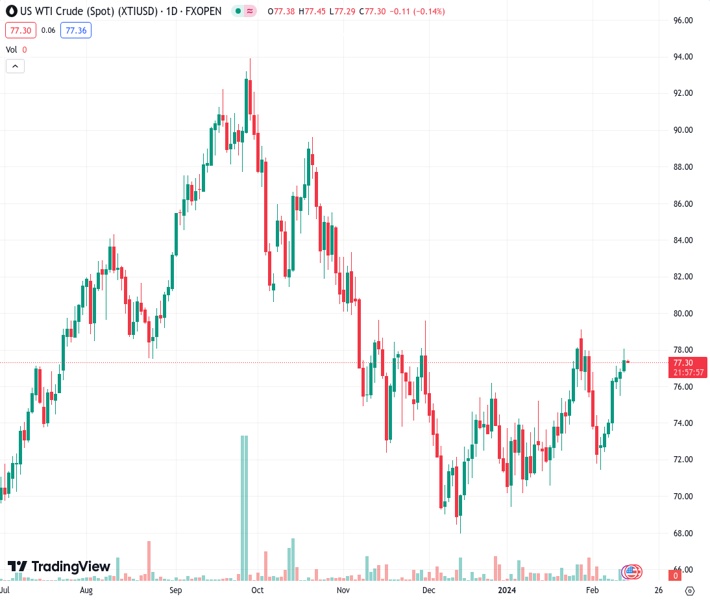
The pair currently trades last at 77.37.
The previous day high was 77.01 while the previous day low was 75.51. The daily 38.2% Fib levels comes at 76.44, expected to provide support. Similarly, the daily 61.8% fib level is at 76.08, expected to provide support.
West Texas Intermediate (WTI) US Crude Oil climbed for a seventh consecutive day on Tuesday, testing the $78.00 per barrel price handle before settling near $77.40. Geopolitical tensions continue to keep Crude Oil bolstered, but an overhang in US crude supplies is weighing down energy markets, alongside a hotter-than-expected US Consumer Price Index (CPI) inflation print restraining investor sentiment.
US CPI inflation declines to 3.1% in January vs. 2.9% forecast
US CPI inflation came in higher and hotter than markets were hoping for, driving down money market expectations of a Federal Reserve (Fed) rate cut. The CME’s FedWatch Tool shows rate markets are now pricing in a first Fed rate trim in June, helping to keep oi barrel bids under pressure.
Geopolitics continue to be the main driver of Crude Oil upside momentum as a ceasefire in the Gaza conflict appears to be elusive, and the Russia-Ukraine conflict continues to slow burn on Eastern European markets as sanctions weigh on Russian Crude Oil markets.
The US’ American Petroleum Institute’s (API) weekly barrel counts showed a surprise buildup of 8.52 million barrels in the US Crude Oil supply stream, a much higher buildup than the forecast 2.6 million barrels. It is the largest buildup of US Crude Oil since the API’s mid-November barrel counts print.
Near-term momentum in WTI US Crude Oil remains firmly bullish, with intraday action trading well above the 200-hour Simple Moving Average (SMA) near $74.72. WTI has traded north of the 200-hour SMA since crossing over the median technical barrier last week, and the near-term technical ceiling sits at Tuesday’s failed breach of the $78.00 handle.
Tuesday’s bullish push left WTI overextended into the 200-day SMA priced in near $77.36, and a failed bullish climb over the key technical indicator will leave WTI bids exposed to an extended backslide into early February’s bottom bids near $72.00.
Technical Levels: Supports and Resistances
XTIUSD currently trading at 77.37 at the time of writing. Pair opened at 76.95 and is trading with a change of 0.55 % .
| Overview | Overview.1 | |
|---|---|---|
| 0 | Today last price | 77.37 |
| 1 | Today Daily Change | 0.42 |
| 2 | Today Daily Change % | 0.55 |
| 3 | Today daily open | 76.95 |
The pair is trading above its 20 Daily moving average @ 74.94, above its 50 Daily moving average @ 73.32 , below its 100 Daily moving average @ 77.45 and above its 200 Daily moving average @ 77.34
| Trends | Trends.1 | |
|---|---|---|
| 0 | Daily SMA20 | 74.94 |
| 1 | Daily SMA50 | 73.32 |
| 2 | Daily SMA100 | 77.45 |
| 3 | Daily SMA200 | 77.34 |
The previous day high was 77.01 while the previous day low was 75.51. The daily 38.2% Fib levels comes at 76.44, expected to provide support. Similarly, the daily 61.8% fib level is at 76.08, expected to provide support.
Note the levels of interest below:
- Pivot support is noted at 75.97, 74.99, 74.48
- Pivot resistance is noted at 77.47, 77.99, 78.97
| Levels | Levels.1 |
|---|---|
| Previous Daily High | 77.01 |
| Previous Daily Low | 75.51 |
| Previous Weekly High | 77.18 |
| Previous Weekly Low | 71.46 |
| Previous Monthly High | 79.19 |
| Previous Monthly Low | 69.41 |
| Daily Fibonacci 38.2% | 76.44 |
| Daily Fibonacci 61.8% | 76.08 |
| Daily Pivot Point S1 | 75.97 |
| Daily Pivot Point S2 | 74.99 |
| Daily Pivot Point S3 | 74.48 |
| Daily Pivot Point R1 | 77.47 |
| Daily Pivot Point R2 | 77.99 |
| Daily Pivot Point R3 | 78.97 |
[/s2If]
Nehcap Trading Strategies
The NEHCAP currently runs the following trading systems for clients. They can be bought and run on your funds.
The system is trading live: LIVE ACCOUNT TRACKING
Contact Us: Contact
The HFT_FIX can be run free for 2 weeks on any broker with a ECN. Apply for a free trial
Join Our Telegram Group
")


