WTI price edges lower after Israel’s series of strikes in Gaza’s southern city of Rafah. (Pivot Orderbook analysis)
…
This is a premium post.
[s2If !current_user_can(access_s2member_level4)]Please register for FREE REGISTER to read full post below containing analysis. In case of any error or you think you are not able to read the full post below, please email us at support#nehcap.com [lwa][/s2If] [s2If current_user_can(access_s2member_level1)]
- WTI price edges lower after Israel’s series of strikes in Gaza’s southern city of Rafah.
- Israeli Prime Minister Binyamin Netanyahu expressed his intention to escalate the military operation into Rafah.
- IMF MD Kristalina Georgieva highlighted that Middle Eastern economies were underperforming compared to growth projections.
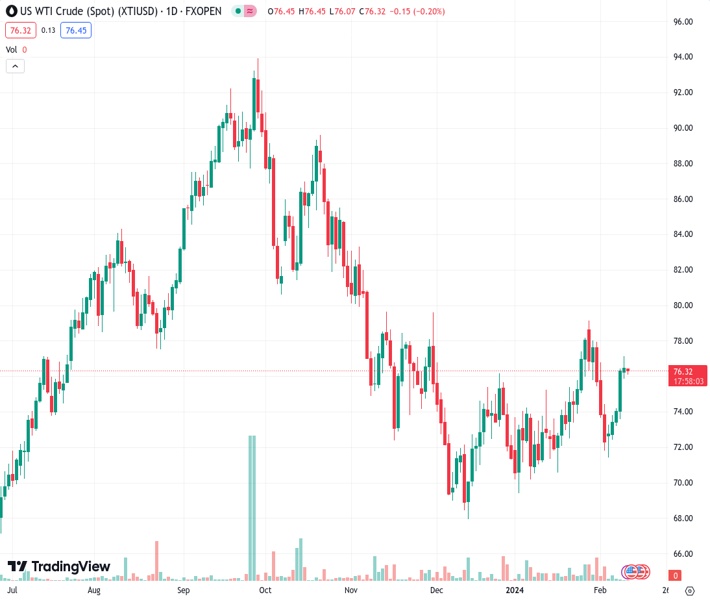
The pair currently trades last at 76.32.
The previous day high was 77.18 while the previous day low was 75.89. The daily 38.2% Fib levels comes at 76.69, expected to provide resistance. Similarly, the daily 61.8% fib level is at 76.38, expected to provide resistance.
West Texas Intermediate (WTI) oil price halts its five-day winning streak from the previous week, trading slightly lower to around $76.30 per barrel during the Asian session on Monday. The decline in Crude oil prices comes as Israel concluded a series of strikes in Gaza’s southern city of Rafah, alleviating concerns about oil supply disruptions in the Red Sea region.
Israeli Prime Minister Binyamin Netanyahu expressed his intention on Sunday to escalate the military operation into Rafah. However, US President Joe Biden cautioned Netanyahu against proceeding with a ground operation in Rafah without a “credible and executable” plan to ensure the safety of the people sheltering there. Hamas also warned Israel that a ground offensive in Rafah could jeopardize future hostage releases.
However, oil prices surged last week on heightened concerns about a potential escalation of geopolitical tensions in the Middle East following Netanyahu’s rejection of a proposal to halt the conflict in the Palestinian enclave.
During the Arab Fiscal Forum in Dubai on Sunday, Kristalina Georgieva, the Managing Director of the International Monetary Fund (IMF), highlighted that Middle East economies were underperforming compared to growth projections. Factors contributing to this included oil production cuts and the Israel-Gaza conflict. Despite this, Georgieva noted that the global economic outlook remained resilient. In its regional economic report last month, the IMF revised its GDP growth forecast for the Middle East and North Africa down to 2.9% for the year, falling below previous projections from October.
On Friday, Baker Hughes released its US Oil Rig Count data, indicating no change in the active rig count, which remained steady at 499. Additionally, the OPEC Monthly Oil Market Report (MOMR) is scheduled for publication on Tuesday. This report covers significant issues impacting the global oil market and offers insights into developments in the Crude oil market.
Technical Levels: Supports and Resistances
XTIUSD currently trading at 76.32 at the time of writing. Pair opened at 76.51 and is trading with a change of -0.25 % .
| Overview | Overview.1 | |
|---|---|---|
| 0 | Today last price | 76.32 |
| 1 | Today Daily Change | -0.19 |
| 2 | Today Daily Change % | -0.25 |
| 3 | Today daily open | 76.51 |
The pair is trading above its 20 Daily moving average @ 74.72, above its 50 Daily moving average @ 73.25 , below its 100 Daily moving average @ 77.57 and below its 200 Daily moving average @ 77.32
| Trends | Trends.1 | |
|---|---|---|
| 0 | Daily SMA20 | 74.72 |
| 1 | Daily SMA50 | 73.25 |
| 2 | Daily SMA100 | 77.57 |
| 3 | Daily SMA200 | 77.32 |
The previous day high was 77.18 while the previous day low was 75.89. The daily 38.2% Fib levels comes at 76.69, expected to provide resistance. Similarly, the daily 61.8% fib level is at 76.38, expected to provide resistance.
Note the levels of interest below:
- Pivot support is noted at 75.88, 75.24, 74.59
- Pivot resistance is noted at 77.16, 77.81, 78.45
| Levels | Levels.1 |
|---|---|
| Previous Daily High | 77.18 |
| Previous Daily Low | 75.89 |
| Previous Weekly High | 77.18 |
| Previous Weekly Low | 71.46 |
| Previous Monthly High | 79.19 |
| Previous Monthly Low | 69.41 |
| Daily Fibonacci 38.2% | 76.69 |
| Daily Fibonacci 61.8% | 76.38 |
| Daily Pivot Point S1 | 75.88 |
| Daily Pivot Point S2 | 75.24 |
| Daily Pivot Point S3 | 74.59 |
| Daily Pivot Point R1 | 77.16 |
| Daily Pivot Point R2 | 77.81 |
| Daily Pivot Point R3 | 78.45 |
[/s2If]
Nehcap Trading Strategies
The NEHCAP currently runs the following trading systems for clients. They can be bought and run on your funds.
The system is trading live: LIVE ACCOUNT TRACKING
Contact Us: Contact
The HFT_FIX can be run free for 2 weeks on any broker with a ECN. Apply for a free trial
Join Our Telegram Group
")


