WTI crude rises 0.25% above $76.50 amid Israel-Hamas conflict escalation and US production changes. (Pivot Orderbook analysis)
…
This is a premium post.
[s2If !current_user_can(access_s2member_level4)]Please register for FREE REGISTER to read full post below containing analysis. In case of any error or you think you are not able to read the full post below, please email us at support#nehcap.com [lwa][/s2If] [s2If current_user_can(access_s2member_level1)]
- WTI crude rises 0.25% above $76.50 amid Israel-Hamas conflict escalation and US production changes.
- Increased geopolitical tensions from Israeli military actions in Gaza and ceasefire rejections impact oil prices.
- US refining shutdowns due to various factors lead to higher gasoline and diesel prices, affecting crude market.
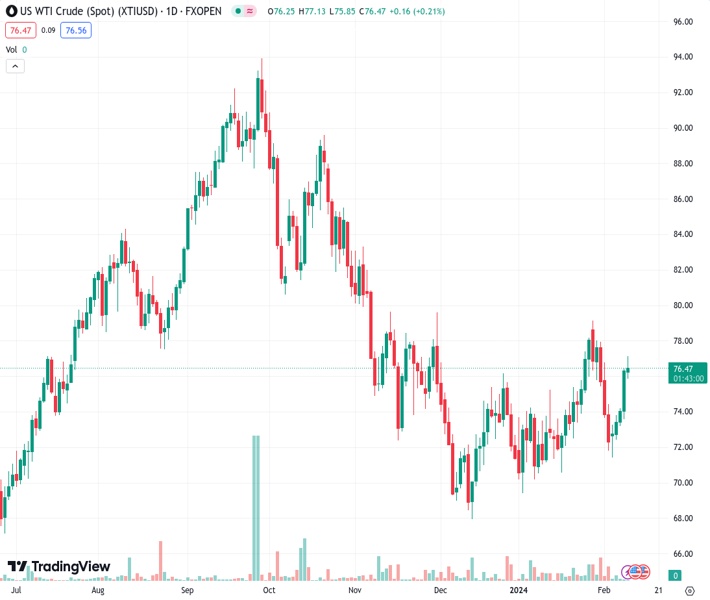
The pair currently trades last at 76.53.
The previous day high was 76.47 while the previous day low was 73.64. The daily 38.2% Fib levels comes at 75.39, expected to provide support. Similarly, the daily 61.8% fib level is at 74.72, expected to provide support.
West Texas Intermediate (WTI), the US crude oil benchmark, rises 0.25% late in the North American session as the Israel-Hamas conflict escalates with Israel rejecting a ceasefire offer. That, along with diminished production in oil refined products, sponsored WTI’s advance, as it trades at $76.54 per barrel.
Israeli military continued their offensive on the Gaza Strip on Friday, sparking a jump in oil prices of around 3% in the previous day. Additionally, refining plants in the US were shut down, which boosted the prices of Gasoline and Diesel.
Ukraine’s attacks against two oil refineries in Southern Russia, and the latter exporting more crude oil in February than planned with the OPEC+, was a tailwind for WTI price.
In the meantime, the US Treasury Department sanctioned three companies based in the United Arab Emirates (UAE) and one ship registered by Liberia for violating a cap placed on the price of Russian oil by a coalition of Western nations.
Oil prices are set to remain range-bound but tilted to the downside, as the 200-day moving average (DMA) at $77.29 remains the first resistance level for prices. A breach of the latter could pave the way for further gains toward the $80.00 pb. Nevertheless, despite being bullish, the Relative Strength Index (RSI), the slope shifted flat, and strong resistance would open the door to challenge the 20-DMA at $74.53. A breach of the latter will expose the latest swing low of $71.46.
Technical Levels: Supports and Resistances
XTIUSD currently trading at 76.53 at the time of writing. Pair opened at 76.39 and is trading with a change of 0.18 % .
| Overview | Overview.1 | |
|---|---|---|
| 0 | Today last price | 76.53 |
| 1 | Today Daily Change | 0.14 |
| 2 | Today Daily Change % | 0.18 |
| 3 | Today daily open | 76.39 |
The pair is trading above its 20 Daily moving average @ 74.54, above its 50 Daily moving average @ 73.2 , below its 100 Daily moving average @ 77.71 and below its 200 Daily moving average @ 77.3
| Trends | Trends.1 | |
|---|---|---|
| 0 | Daily SMA20 | 74.54 |
| 1 | Daily SMA50 | 73.20 |
| 2 | Daily SMA100 | 77.71 |
| 3 | Daily SMA200 | 77.30 |
The previous day high was 76.47 while the previous day low was 73.64. The daily 38.2% Fib levels comes at 75.39, expected to provide support. Similarly, the daily 61.8% fib level is at 74.72, expected to provide support.
Note the levels of interest below:
- Pivot support is noted at 74.53, 72.66, 71.69
- Pivot resistance is noted at 77.36, 78.34, 80.2
| Levels | Levels.1 |
|---|---|
| Previous Daily High | 76.47 |
| Previous Daily Low | 73.64 |
| Previous Weekly High | 79.19 |
| Previous Weekly Low | 71.83 |
| Previous Monthly High | 79.19 |
| Previous Monthly Low | 69.41 |
| Daily Fibonacci 38.2% | 75.39 |
| Daily Fibonacci 61.8% | 74.72 |
| Daily Pivot Point S1 | 74.53 |
| Daily Pivot Point S2 | 72.66 |
| Daily Pivot Point S3 | 71.69 |
| Daily Pivot Point R1 | 77.36 |
| Daily Pivot Point R2 | 78.34 |
| Daily Pivot Point R3 | 80.20 |
[/s2If]
Nehcap Trading Strategies
The NEHCAP currently runs the following trading systems for clients. They can be bought and run on your funds.
The system is trading live: LIVE ACCOUNT TRACKING
Contact Us: Contact
The HFT_FIX can be run free for 2 weeks on any broker with a ECN. Apply for a free trial
Join Our Telegram Group
")


