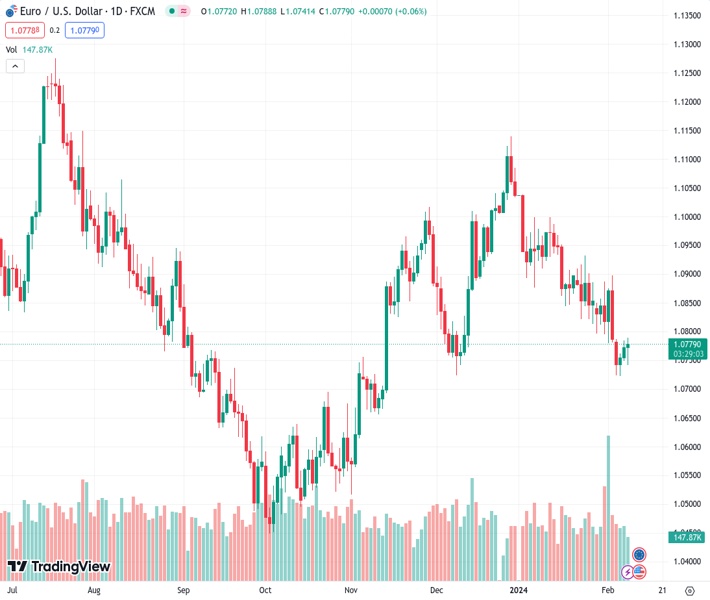
The DXY stabilized at 104.15 on Thursday after reaching a daily high of 104.40.
…
This is a premium post.
[s2If !current_user_can(access_s2member_level4)]Please register for FREE REGISTER to read full post below containing analysis. In case of any error or you think you are not able to read the full post below, please email us at support#nehcap.com [lwa][/s2If] [s2If current_user_can(access_s2member_level1)]
- The DXY stabilized at 104.15 on Thursday after reaching a daily high of 104.40.
- Weekly Jobless Claims came in higher than expected in the week ended in February 3.
- Markets digest Fed official Barkin’s words.
The US Dollar (USD) steadily rose on Thursday, initially to 103.45 and then stabilizing at 104.15 on the back of positive Initial Jobless Claims figures. However, bulls seem to be running out of steam due to a lack of fresh drivers, while Federal Reserve (Fed) speakers refuse to give additional guidance on the bank’s next steps.
The US Federal Reserve’s Chair, Jerome Powell, commented that he considered a cut in March “unlikely”, adding that the bank needs more evidence on inflation coming down to gain confidence for cutting rates. Several officials were on the wires this week but didn’t give new guidance, basically confirming that the Fed awaits more data and disregards cuts in March.
The daily Relative Strength Index (RSI) shows a flat slope, albeit in positive territory, hinting at a gradual slowdown in buying momentum. However, it is too soon to anticipate a bearish reversal as positive territory generally denotes a bullish bias.
The Moving Average Convergence Divergence (MACD) presents flat green bars, illustrating a slowdown in bullish momentum but without a bearish crossover. The MACD indicates that buying pressure is still present, albeit reduced.
Regarding the Simple Moving Averages (SMAs), the index is anchored above the 20-day and 200-day SMAs, signaling a bullish bias in the longer framework, yet it is trading below the 100-day SMA, demonstrating some bearish pressure in the intermediate term. In conclusion, the short-term technical outlook seems to be tilted in favor of the bulls, albeit with weakening momentum.
[/s2If]
Nehcap Trading Strategies
The NEHCAP currently runs the following trading systems for clients. They can be bought and run on your funds.
The system is trading live: LIVE ACCOUNT TRACKING
Contact Us: Contact
The HFT_FIX can be run free for 2 weeks on any broker with a ECN. Apply for a free trial
Join Our Telegram Group
")


