WTI crude rises 0.87% to $73.51, lifted by a weaker US Dollar and lower US oil production forecasts. (Pivot Orderbook analysis)
…
This is a premium post.
[s2If !current_user_can(access_s2member_level4)]Please register for FREE REGISTER to read full post below containing analysis. In case of any error or you think you are not able to read the full post below, please email us at support#nehcap.com [lwa][/s2If] [s2If current_user_can(access_s2member_level1)]
- WTI crude rises 0.87% to $73.51, lifted by a weaker US Dollar and lower US oil production forecasts.
- Fed’s cautious interest rate outlook, with Mester highlighting a data-driven approach, affects market sentiment.
- US Energy Department cuts 2024 oil production growth estimates, influencing prices.
The pair currently trades last at 73.59.
The previous day high was 73.29 while the previous day low was 71.46. The daily 38.2% Fib levels comes at 72.59, expected to provide support. Similarly, the daily 61.8% fib level is at 72.16, expected to provide support.
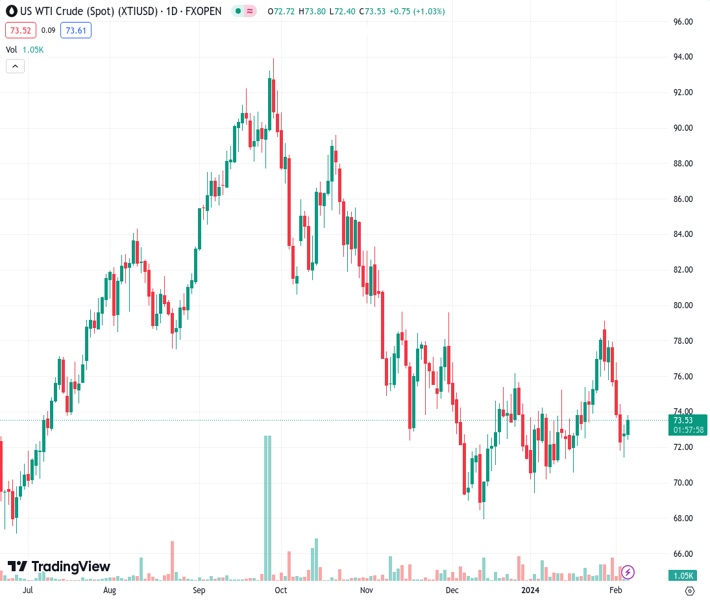
The US crude oil benchmark, also known as West Texas Intermediate or WTI, rises some 0.87% on the day as the Greenback weakens, despite Fed officials pushing back against rate cut expectations. That, along with a report by the US Energy Department lowering oil production, were the drivers behind the rise in oil prices. At the time of writing, WTI trades at $73.51 after hitting a low of $72.41.
Federal Reserve (Fed) officials continued to cross the wires, with most of them seen as ready to cut rates but adopting a data-dependent stance. The last official crossing the wires was Loretta Mester, who said she sees no rush on cutting rates and that its complex offers a timing on when it would begin the easing cycle. Mester said that she expects rate cuts later in the year.
Aside from this, the US Department of Energy revealed that crude oil production will rise 170K barrels per day in 2024, down from forecasts of 290K.
In the meantime, the de-escalation of the Israel-Hamas conflict would be a relief for oil traders and can drive prices lower.
On Tuesday, the US Secretary of State Anthony Blinken said that Hames had replied to an Israel proposal for the cease-fire, saying it would be examined in the coming hours.
US oil inventory data will be released later on Tuesday, expected to show an increase in inventories for gasoline and diesel. A Reuters poll shows crude inventories climbing about 2.1 million barrels in the week to February 2.
Technical Levels: Supports and Resistances
XTIUSD currently trading at 73.59 at the time of writing. Pair opened at 72.89 and is trading with a change of 0.96 % .
| Overview | Overview.1 | |
|---|---|---|
| 0 | Today last price | 73.59 |
| 1 | Today Daily Change | 0.70 |
| 2 | Today Daily Change % | 0.96 |
| 3 | Today daily open | 72.89 |
The pair is trading below its 20 Daily moving average @ 74.13, above its 50 Daily moving average @ 73.31 , below its 100 Daily moving average @ 78.16 and below its 200 Daily moving average @ 77.22
| Trends | Trends.1 | |
|---|---|---|
| 0 | Daily SMA20 | 74.13 |
| 1 | Daily SMA50 | 73.31 |
| 2 | Daily SMA100 | 78.16 |
| 3 | Daily SMA200 | 77.22 |
The previous day high was 73.29 while the previous day low was 71.46. The daily 38.2% Fib levels comes at 72.59, expected to provide support. Similarly, the daily 61.8% fib level is at 72.16, expected to provide support.
Note the levels of interest below:
- Pivot support is noted at 71.81, 70.72, 69.98
- Pivot resistance is noted at 73.64, 74.38, 75.47
| Levels | Levels.1 |
|---|---|
| Previous Daily High | 73.29 |
| Previous Daily Low | 71.46 |
| Previous Weekly High | 79.19 |
| Previous Weekly Low | 71.83 |
| Previous Monthly High | 79.19 |
| Previous Monthly Low | 69.41 |
| Daily Fibonacci 38.2% | 72.59 |
| Daily Fibonacci 61.8% | 72.16 |
| Daily Pivot Point S1 | 71.81 |
| Daily Pivot Point S2 | 70.72 |
| Daily Pivot Point S3 | 69.98 |
| Daily Pivot Point R1 | 73.64 |
| Daily Pivot Point R2 | 74.38 |
| Daily Pivot Point R3 | 75.47 |
[/s2If]
Nehcap Trading Strategies
The NEHCAP currently runs the following trading systems for clients. They can be bought and run on your funds.
The system is trading live: LIVE ACCOUNT TRACKING
Contact Us: Contact
The HFT_FIX can be run free for 2 weeks on any broker with a ECN. Apply for a free trial
Join Our Telegram Group
")


