The currently stands at $2,035 up by 0.52%. (Pivot Orderbook analysis)
…
This is a premium post.
[s2If !current_user_can(access_s2member_level4)]Please register for FREE REGISTER to read full post below containing analysis. In case of any error or you think you are not able to read the full post below, please email us at support#nehcap.com [lwa][/s2If] [s2If current_user_can(access_s2member_level1)]
- The XAU/USD currently stands at $2,035 up by 0.52%.
- Bulls show signs of recovery after two sessions of losses favored by a weaker US Dollar.
- On the hourly chart, indicator readings are pausing their advance to consolidate gains.
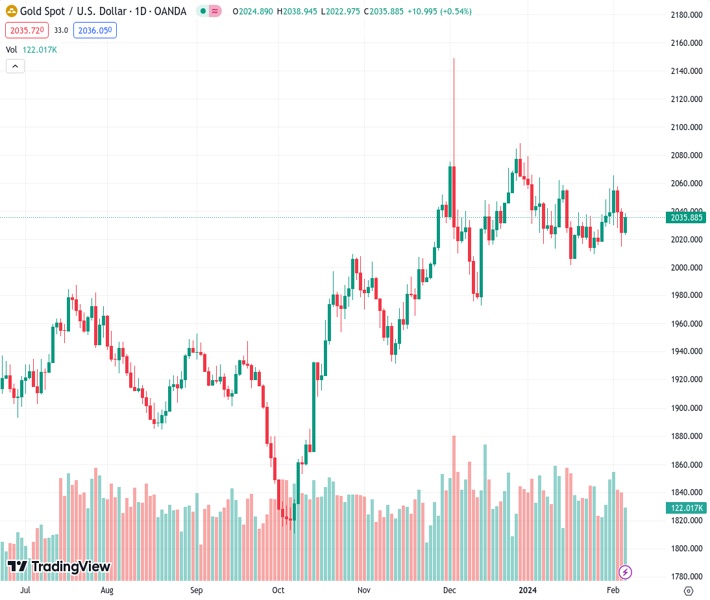
- Bulls still control the daily chart as buyers recovered the 20-day SMA.
The pair currently trades last at 2035.39.
The previous day high was 2042.32 while the previous day low was 2014.92. The daily 38.2% Fib levels comes at 2025.39, expected to provide support. Similarly, the daily 61.8% fib level is at 2031.85, expected to provide support.
In Tuesday’s session, the XAU/USD surged to $2,035, reaffirming its bullish scenario in the daily chart. Despite central banks evading sooner rate cuts, bulls still show dominance favored by lower US Treasury yields, often seen as the cost of holding non-yielding metals. On the hourly outlook seems under strain as investors consolidate gains, leading to a loss in momentum as indicated by weakened technical indicators.
Looking at the signals on the daily chart, the bull’s strength prevails. This bullish sentiment is supported by the positive upslope of the Relative Strength Index (RSI) and the increasing green histogram bars of the Moving Average Convergence Divergence (MACD), both suggesting a strong buying momentum. Besides, the price is trading above its 20, 100, 200-day Simple Moving Averages (SMAs), underlining the dominance of buyers in the longer-term trend. In addition, as long as the buyers manage to hold above the 20-day average, the outlook will still be positive for the short-term.
Shifting focus to the hourly chart, the momentum seems to show some exhaustion as investors start to consolidate their gains.This indicates that in case no fundamental stimulus arises, the price may continue trading flat ahead of Wednesday’s Asian session.
Technical Levels: Supports and Resistances
XAUUSD currently trading at 2035.39 at the time of writing. Pair opened at 2025.07 and is trading with a change of 0.51 % .
| Overview | Overview.1 | |
|---|---|---|
| 0 | Today last price | 2035.39 |
| 1 | Today Daily Change | 10.32 |
| 2 | Today Daily Change % | 0.51 |
| 3 | Today daily open | 2025.07 |
The pair remains strongly bullish on the daily timeframe. It trades above its 20 SMA @ 2029.39, 50 SMA 2034.48, 100 SMA @ 1985.57 and 200 SMA @ 1965.99.
| Trends | Trends.1 | |
|---|---|---|
| 0 | Daily SMA20 | 2029.39 |
| 1 | Daily SMA50 | 2034.48 |
| 2 | Daily SMA100 | 1985.57 |
| 3 | Daily SMA200 | 1965.99 |
The previous day high was 2042.32 while the previous day low was 2014.92. The daily 38.2% Fib levels comes at 2025.39, expected to provide support. Similarly, the daily 61.8% fib level is at 2031.85, expected to provide support.
Note the levels of interest below:
- Pivot support is noted at 2012.55, 2000.04, 1985.15
- Pivot resistance is noted at 2039.95, 2054.84, 2067.35
| Levels | Levels.1 |
|---|---|
| Previous Daily High | 2042.32 |
| Previous Daily Low | 2014.92 |
| Previous Weekly High | 2065.49 |
| Previous Weekly Low | 2018.39 |
| Previous Monthly High | 2079.01 |
| Previous Monthly Low | 2001.90 |
| Daily Fibonacci 38.2% | 2025.39 |
| Daily Fibonacci 61.8% | 2031.85 |
| Daily Pivot Point S1 | 2012.55 |
| Daily Pivot Point S2 | 2000.04 |
| Daily Pivot Point S3 | 1985.15 |
| Daily Pivot Point R1 | 2039.95 |
| Daily Pivot Point R2 | 2054.84 |
| Daily Pivot Point R3 | 2067.35 |
[/s2If]
Nehcap Trading Strategies
The NEHCAP currently runs the following trading systems for clients. They can be bought and run on your funds.
The system is trading live: LIVE ACCOUNT TRACKING
Contact Us: Contact
The HFT_FIX can be run free for 2 weeks on any broker with a ECN. Apply for a free trial
Join Our Telegram Group
")


