Market rate expectations remains de-coupled from Fed language. (Pivot Orderbook analysis)
…
This is a premium post.
[s2If !current_user_can(access_s2member_level4)]Please register for FREE REGISTER to read full post below containing analysis. In case of any error or you think you are not able to read the full post below, please email us at support#nehcap.com [lwa][/s2If] [s2If current_user_can(access_s2member_level1)]
- Market rate expectations remains de-coupled from Fed language.
- US Services PMI and service provider inflation remain elevated.
- Markets left to chew on rate-cut potential with little high-impact data remaining.
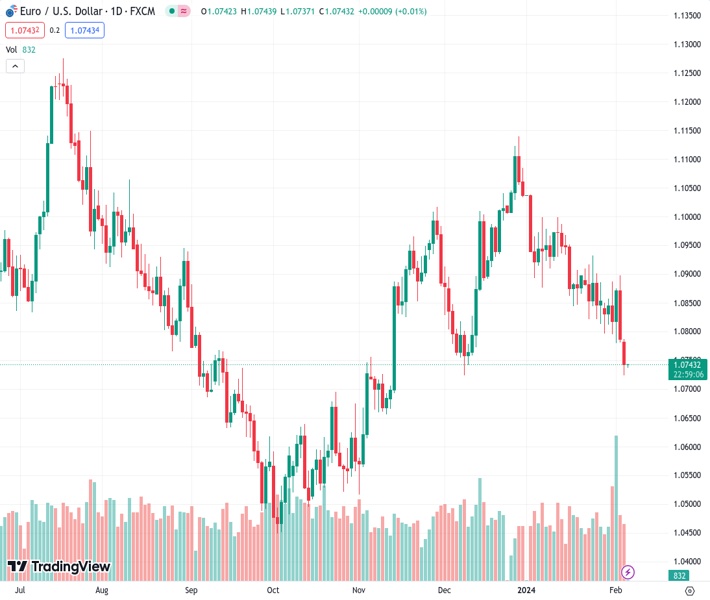
The pair currently trades last at 4938.73.
The previous day high was 4973.1 while the previous day low was 4903.1. The daily 38.2% Fib levels comes at 4946.36, expected to provide resistance. Similarly, the daily 61.8% fib level is at 4929.84, expected to provide support.
.
US equity markets saw red on Monday, driven to early declines after Federal Reserve (Fed) Chairman Jerome Powell dashed broad-market rate cut hopes on the rocks of reality even further after the central bank head made a rare mainstream media appearance during an interview with 60 Minutes early Monday. US data further pinned rate cut expectations to the floorboards as US Services Purchasing Managers’ Index (PMI) figures show a four-month uptick in activity, while services providers saw an uptick in inflation as prices rise on economic activity.
Fed Chairman Jerome Powell chilled market rate cut hopes even further during an interview with ‘60 Minutes’, noting that the “job’s not quite done” on inflation, with the US central bank head striking a cautious tone an reiterating recent warnings that market expectations for rate cuts have outrun what the Fed is both willing and able to deliver.
US economic data further complicated matters for rate-cut shoppers after January’s US ISM Services PMI ticked into a four-month high of 53.4, clearing the forecast 52.0 and vaulting over the previous month’s 50.5 (revised from 50.6). US ISM Services Prices Paid also ripped higher in January, with the index climbing to 64.0 compared to the previous month’s 56.7 (revised from 57.4).
With the rest of the week’s economic data docket showing strictly mid-tier releases from the US, markets will be shifting to earnings releases from major equities to drive sentiment. According to the CME’s FedWatch Tool, markets are now pricing in only a 16% chance of a rate cut from the Fed in March, down significantly from December’s 80%-plus money market bets. May’s rate cut chances have also been revised sharply lower, with markets nearly split on whether or not the FEd will trim rates at the May meeting.
The NASDAQ Composite index declined 0.2%, or 31.28 points, to close Monday at $15,597.68, while the S&P 500 shed over 15 points to close down 0.32% at $4,942.81. The DJIA saw the heaviest index declines of the day, falling 0.71% and shedding 274 points to end thew day at $38,380.12.
The Standard & Poor’s (S&P) 500 major equity index got capped below the $4,960.00 level on Monday, falling back from last Friday’s peak at $4,973.10. Intraday action remains well-bid, trading on the bullish side of the 200-hour Simple Moving Average (SMA) near $4,870.00.
Despite near-term bearish pressure, the major index remains firmly planted in bull country, with the S&P index continuing to grind towards the $5,000.00 major handle on daily candlesticks, and it would take a 10% decline to drag the S&P into bearish territory on the low side of the 200-day SMA below $4,500.00.
Technical Levels: Supports and Resistances
EURUSD currently trading at 4938.73 at the time of writing. Pair opened at 4955.49 and is trading with a change of -0.34 % .
| Overview | Overview.1 | |
|---|---|---|
| 0 | Today last price | 4938.73 |
| 1 | Today Daily Change | -16.76 |
| 2 | Today Daily Change % | -0.34 |
| 3 | Today daily open | 4955.49 |
The pair remains strongly bullish on the daily timeframe. It trades above its 20 SMA @ 4833.35, 50 SMA 4733.83, 100 SMA @ 4538.39 and 200 SMA @ 4454.63.
| Trends | Trends.1 | |
|---|---|---|
| 0 | Daily SMA20 | 4833.35 |
| 1 | Daily SMA50 | 4733.83 |
| 2 | Daily SMA100 | 4538.39 |
| 3 | Daily SMA200 | 4454.63 |
The previous day high was 4973.1 while the previous day low was 4903.1. The daily 38.2% Fib levels comes at 4946.36, expected to provide resistance. Similarly, the daily 61.8% fib level is at 4929.84, expected to provide support.
Note the levels of interest below:
- Pivot support is noted at 4914.69, 4873.9, 4844.69
- Pivot resistance is noted at 4984.69, 5013.9, 5054.69
| Levels | Levels.1 |
|---|---|
| Previous Daily High | 4973.10 |
| Previous Daily Low | 4903.10 |
| Previous Weekly High | 4973.10 |
| Previous Weekly Low | 4844.48 |
| Previous Monthly High | 4929.82 |
| Previous Monthly Low | 4662.84 |
| Daily Fibonacci 38.2% | 4946.36 |
| Daily Fibonacci 61.8% | 4929.84 |
| Daily Pivot Point S1 | 4914.69 |
| Daily Pivot Point S2 | 4873.90 |
| Daily Pivot Point S3 | 4844.69 |
| Daily Pivot Point R1 | 4984.69 |
| Daily Pivot Point R2 | 5013.90 |
| Daily Pivot Point R3 | 5054.69 |
[/s2If]
Nehcap Trading Strategies
The NEHCAP currently runs the following trading systems for clients. They can be bought and run on your funds.
The system is trading live: LIVE ACCOUNT TRACKING
Contact Us: Contact
The HFT_FIX can be run free for 2 weeks on any broker with a ECN. Apply for a free trial
Join Our Telegram Group
")


