Gold price plunges for the second straight session as investors see Fed rate cut after spring.
…
This is a premium post.
[s2If !current_user_can(access_s2member_level4)]Please register for FREE REGISTER to read full post below containing analysis. In case of any error or you think you are not able to read the full post below, please email us at support#nehcap.com [lwa][/s2If] [s2If current_user_can(access_s2member_level1)]
- Gold price plunges for the second straight session as investors see Fed rate cut after spring.
- Robust demand for workers has tampered Fed rate-cut bets.
- The outlook for the US dollar and bond yields has improved significantly.
Gold price (XAU/USD) continues to face a sell-off in Monday’s European session due to upbeat United States Nonfarm Payrolls (NFP) data for January. Investors see the Federal Reserve (Fed) keeping interest rates unchanged in March’s monetary policy meeting in the range of 5.25%-5.50% as robust labor market data has strengthened the argument for maintaining higher interest rates till Spring ends.
Strong labor demand and higher wage offerings by US employers to retain or hire workers indicate a bright demand outlook. This has also indicated a persistent inflation environment, and therefore, interest rates must remain higher to prevent further escalation.
While the Gold price has come under pressure, the outlook for US bond yields and the US Dollar Index (DXY) has improved significantly. The USD Index has recaptured the 104.00 resistance for the first time in two months. Meanwhile, the US Institute of Supply Management (ISM) Services PMI for January is in focus representing the service sector, which accounts for two-thirds of the economy.
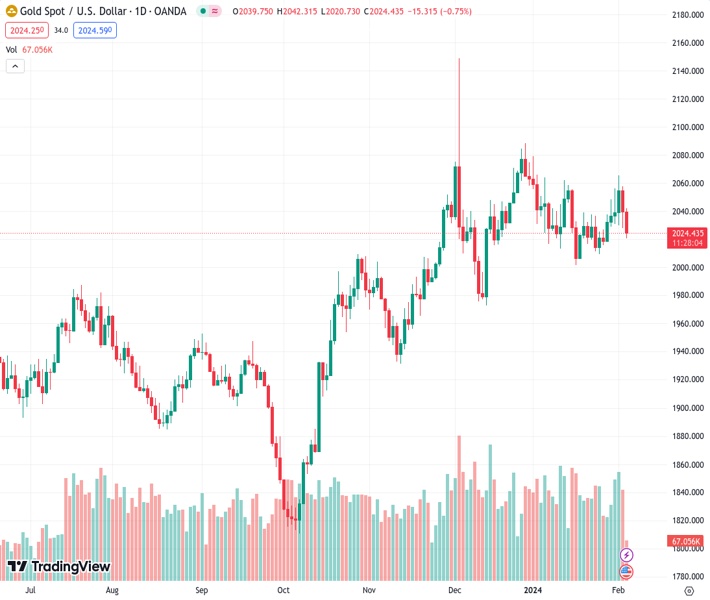
Gold price delivers a steep downside move as investors see a rate cut by the Fed delayed to May. The outlook for the precious metal has dampened as it has failed to sustain the breakout of the Symmetrical Triangle chart pattern formed on a daily time frame. The yellow metal has dropped below the 20 and 50-day Exponential Moving Averages (EMAs), which hover near $2,033 and $2,022 respectively.
The 14-period Relative Strength Index (RSI) oscillates in the 40.00-60.00, which indicates a lackluster move ahead.
[/s2If]
Nehcap Trading Strategies
The NEHCAP currently runs the following trading systems for clients. They can be bought and run on your funds.
The system is trading live: LIVE ACCOUNT TRACKING
Contact Us: Contact
The HFT_FIX can be run free for 2 weeks on any broker with a ECN. Apply for a free trial
Join Our Telegram Group
")


