WTI prices post their first monthly gain since September amid the ongoing Middle East geopolitical conflict. (Pivot Orderbook analysis)
…
This is a premium post.
[s2If !current_user_can(access_s2member_level4)]Please register for FREE REGISTER to read full post below containing analysis. In case of any error or you think you are not able to read the full post below, please email us at support#nehcap.com [lwa][/s2If] [s2If current_user_can(access_s2member_level1)]
- WTI prices post their first monthly gain since September amid the ongoing Middle East geopolitical conflict.
- IEA said that global oil demand will likely increase by 2mb/d in 2024.
- A surprise build in US crude inventories dragged WTI prices lower.
- Oil traders will monitor the Chinese Caixin Manufacturing PMI data on Thursday.
The pair currently trades last at 76.1.
The previous day high was 78.0 while the previous day low was 75.47. The daily 38.2% Fib levels comes at 76.44, expected to provide resistance. Similarly, the daily 61.8% fib level is at 77.03, expected to provide resistance.
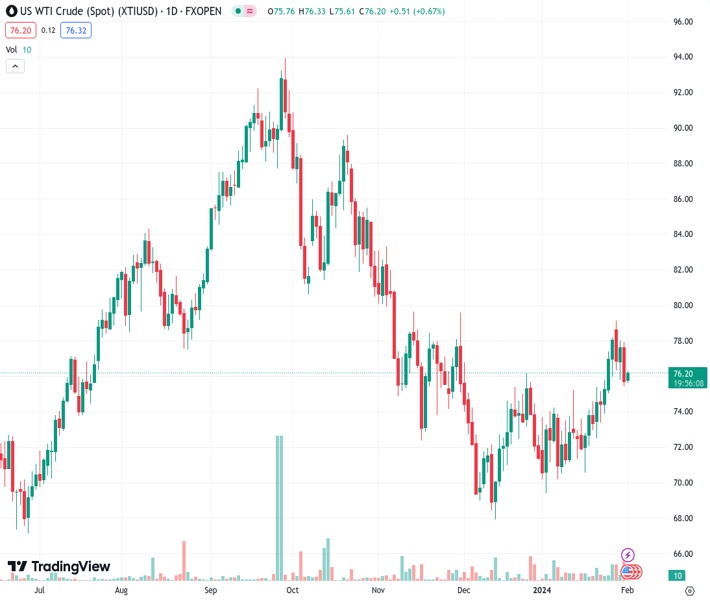
Western Texas Intermediate (WTI), the US crude oil benchmark, is trading around $76.25 after bouncing off the weekly lows of $75.43 on Thursday. WTI prices snap the three-month losing streak amid the ongoing geopolitical tensions in the Middle East, keeping global crude supply risks elevated.
The International Energy Agency (IEA) Executive Director, Fatih Birol, said that global oil demand will likely increase by 2 mb/d in 2024, similar to the growth achieved in 2023. He further stated that demand will keep rising until at least 2030. Additionally, the rising Middle East geopolitical tensions highlight the potential risk to crude supplies in the region, which lifts WTI prices.
On the other hand, the upside of WTI prices might be limited due to the disappointing Chinese Manufacturing PMI data. On Wednesday, China’s NBS Manufacturing PMI came in at 49.2 in January versus 49.0 prior, below the market consensus of 49.2. Manufacturing activity in China contracted for a fourth straight month in January, which exerts some selling pressure on WTI prices as China is the leading crude importer in the world.
Apart from this, a surprise build in US weekly crude inventories dragged WTI lower on Wednesday. Inventories of US crude unexpectedly rose by 1.23M barrels for the week ended January 29 from the previous week’s 9.233M barrels decline, compared with market expectations for a 217K barrel draw, according to the Energy Information Administration.
Oil traders await the January Chinese Caixin Manufacturing PMI, due on Thursday. Later in the day, the US weekly Initial Jobless Claims and ISM Manufacturing PMI will be due. These events could significantly impact the USD-denominated WTI price. Oil traders will take cues from the data and find trading opportunities around WTI prices.
Technical Levels: Supports and Resistances
XTIUSD currently trading at 76.1 at the time of writing. Pair opened at 75.71 and is trading with a change of 0.52 % .
| Overview | Overview.1 | |
|---|---|---|
| 0 | Today last price | 76.10 |
| 1 | Today Daily Change | 0.39 |
| 2 | Today Daily Change % | 0.52 |
| 3 | Today daily open | 75.71 |
The pair is trading above its 20 Daily moving average @ 74.06, above its 50 Daily moving average @ 73.47 , below its 100 Daily moving average @ 78.68 and below its 200 Daily moving average @ 77.26
| Trends | Trends.1 | |
|---|---|---|
| 0 | Daily SMA20 | 74.06 |
| 1 | Daily SMA50 | 73.47 |
| 2 | Daily SMA100 | 78.68 |
| 3 | Daily SMA200 | 77.26 |
The previous day high was 78.0 while the previous day low was 75.47. The daily 38.2% Fib levels comes at 76.44, expected to provide resistance. Similarly, the daily 61.8% fib level is at 77.03, expected to provide resistance.
Note the levels of interest below:
- Pivot support is noted at 74.79, 73.87, 72.27
- Pivot resistance is noted at 77.31, 78.91, 79.83
| Levels | Levels.1 |
|---|---|
| Previous Daily High | 78.00 |
| Previous Daily Low | 75.47 |
| Previous Weekly High | 78.20 |
| Previous Weekly Low | 72.55 |
| Previous Monthly High | 79.19 |
| Previous Monthly Low | 69.41 |
| Daily Fibonacci 38.2% | 76.44 |
| Daily Fibonacci 61.8% | 77.03 |
| Daily Pivot Point S1 | 74.79 |
| Daily Pivot Point S2 | 73.87 |
| Daily Pivot Point S3 | 72.27 |
| Daily Pivot Point R1 | 77.31 |
| Daily Pivot Point R2 | 78.91 |
| Daily Pivot Point R3 | 79.83 |
[/s2If]
Nehcap Trading Strategies
The NEHCAP currently runs the following trading systems for clients. They can be bought and run on your funds.
The system is trading live: LIVE ACCOUNT TRACKING
Contact Us: Contact
The HFT_FIX can be run free for 2 weeks on any broker with a ECN. Apply for a free trial
Join Our Telegram Group
")


