WTI attracts some buyers on Tuesday amid fears about supply disruptions in the Middle East. (Pivot Orderbook analysis)
…
This is a premium post.
[s2If !current_user_can(access_s2member_level4)]Please register for FREE REGISTER to read full post below containing analysis. In case of any error or you think you are not able to read the full post below, please email us at support#nehcap.com [lwa][/s2If] [s2If current_user_can(access_s2member_level1)]
- WTI attracts some buyers on Tuesday amid fears about supply disruptions in the Middle East.
- Demand concerns in China could act as a headwind for the commodity ahead of the FOMC.
- Traders now look to the API report on US stockpiles for short-term opportunities on Tuesday.
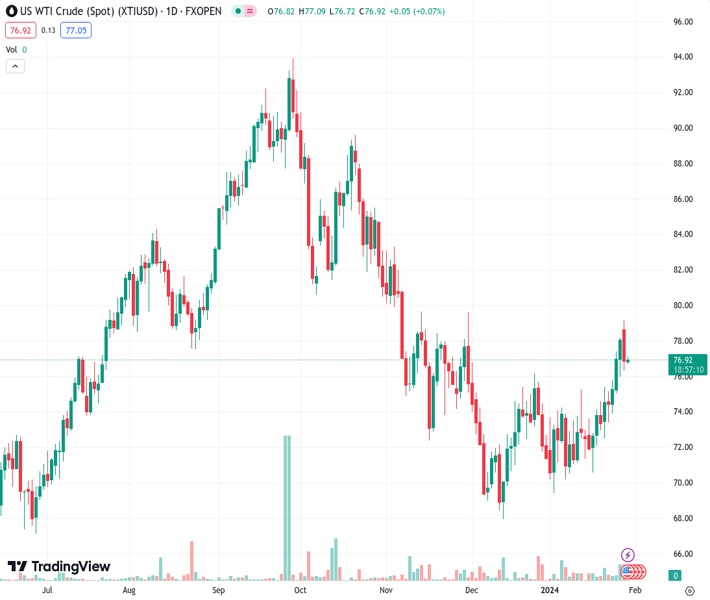
The pair currently trades last at 77.0.
The previous day high was 79.19 while the previous day low was 76.38. The daily 38.2% Fib levels comes at 77.46, expected to provide resistance. Similarly, the daily 61.8% fib level is at 78.12, expected to provide resistance.
West Texas Intermediate (WTI) US Crude Oil prices tick higher during the Asian session on Tuesday and for now, seem to have stalled the previous day’s rejection slide from the 100-day Simple Moving Average (SMA) or a nearly two-month peak.
A further escalation of geopolitical tensions in the Middle East continues to fuel supply concerns and turns out to be a key factor acting as a tailwind for the black liquid. A deadly drone attack on a US base in Jordan by Iran-backed militants killed three American soldiers, marking the first death of US service personnel in the region since the Hamas-Israel war broke out on October 7. Reports suggest that President Joe Biden will authorise US military action, which would begin in the next couple of days and come in waves against a range of targets.
A direct US confrontation with Iran, which exported around 1.2-1.6 million barrels per day or 1-1.5% of Crude Oil through most of 2023, will adversely impact global supply. Adding to this, an attack on an oil tanker in the Red Sea over the weekend has raised the risks of supply disruptions in the region and might continue to lend some support to Crude Oil prices. That said, the lack of follow-through buying suggests that bulls seem reluctant to place aggressive bets in the wake of demand concerns in China – the world’s top Oil importer.
Market participants might also prefer to wait on the sidelines ahead of the highly-anticipated two-day FOMC monetary policy meeting starting this Tuesday. Investors will look for cues about the timing of when the Federal Reserve (Fed) will start cutting interest rates. This, in turn, will influence the US Dollar (USD) price dynamics and drive demand for the USD-denominated commodities. In the meantime, the American Petroleum Institute (API) industry group will publish US stockpile data on Tuesday and provide some impetus to Crude Oil prices.
Technical Levels: Supports and Resistances
XTIUSD currently trading at 77.0 at the time of writing. Pair opened at 76.96 and is trading with a change of 0.05 % .
| Overview | Overview.1 | |
|---|---|---|
| 0 | Today last price | 77.00 |
| 1 | Today Daily Change | 0.04 |
| 2 | Today Daily Change % | 0.05 |
| 3 | Today daily open | 76.96 |
The pair is trading above its 20 Daily moving average @ 73.57, above its 50 Daily moving average @ 73.5 , below its 100 Daily moving average @ 78.91 and below its 200 Daily moving average @ 77.25
| Trends | Trends.1 | |
|---|---|---|
| 0 | Daily SMA20 | 73.57 |
| 1 | Daily SMA50 | 73.50 |
| 2 | Daily SMA100 | 78.91 |
| 3 | Daily SMA200 | 77.25 |
The previous day high was 79.19 while the previous day low was 76.38. The daily 38.2% Fib levels comes at 77.46, expected to provide resistance. Similarly, the daily 61.8% fib level is at 78.12, expected to provide resistance.
Note the levels of interest below:
- Pivot support is noted at 75.83, 74.7, 73.02
- Pivot resistance is noted at 78.64, 80.33, 81.46
| Levels | Levels.1 |
|---|---|
| Previous Daily High | 79.19 |
| Previous Daily Low | 76.38 |
| Previous Weekly High | 78.20 |
| Previous Weekly Low | 72.55 |
| Previous Monthly High | 76.79 |
| Previous Monthly Low | 67.97 |
| Daily Fibonacci 38.2% | 77.46 |
| Daily Fibonacci 61.8% | 78.12 |
| Daily Pivot Point S1 | 75.83 |
| Daily Pivot Point S2 | 74.70 |
| Daily Pivot Point S3 | 73.02 |
| Daily Pivot Point R1 | 78.64 |
| Daily Pivot Point R2 | 80.33 |
| Daily Pivot Point R3 | 81.46 |
[/s2If]
Nehcap Trading Strategies
The NEHCAP currently runs the following trading systems for clients. They can be bought and run on your funds.
The system is trading live: LIVE ACCOUNT TRACKING
Contact Us: Contact
The HFT_FIX can be run free for 2 weeks on any broker with a ECN. Apply for a free trial
Join Our Telegram Group
")


