West Texas Intermediate (WTI) oil climbs 1.25%, driven by escalating tensions in the Middle East and positive global economic projections from the IMF. (Pivot Orderbook analysis)
…
This is a premium post.
[s2If !current_user_can(access_s2member_level4)]Please register for FREE REGISTER to read full post below containing analysis. In case of any error or you think you are not able to read the full post below, please email us at support#nehcap.com [lwa][/s2If] [s2If current_user_can(access_s2member_level1)]
- West Texas Intermediate (WTI) oil climbs 1.25%, driven by escalating tensions in the Middle East and positive global economic projections from the IMF.
- IMF’s revised forecast boosts optimism for the US and Chinese economies, countering concerns from China’s real estate sector issues.
- Upcoming OPEC+ meeting and expectations of a US crude inventory drawdown boosted Oil prices.
The pair currently trades last at 77.86.
The previous day high was 79.19 while the previous day low was 76.38. The daily 38.2% Fib levels comes at 77.46, expected to provide support. Similarly, the daily 61.8% fib level is at 78.12, expected to provide resistance.
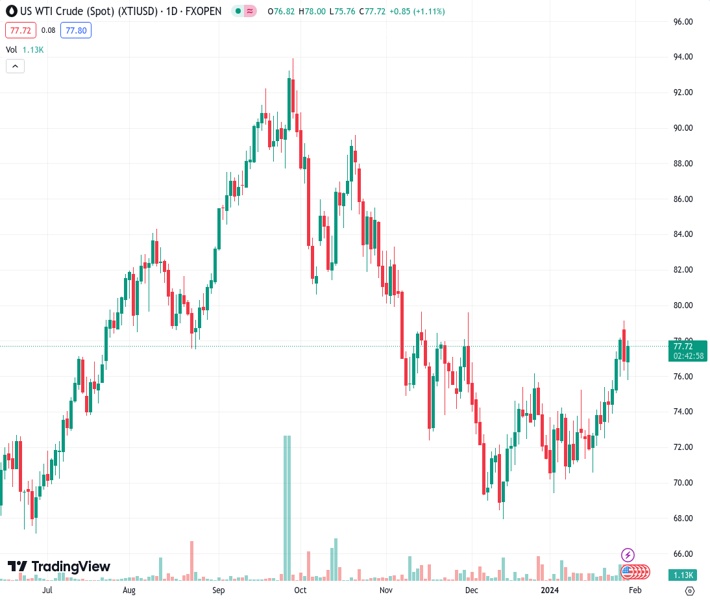
West Texas Intermediate (WTI), the US Crude Oil benchmark, rises amid escalating tensions in the Middle East, along with updated forecasts of the International Monetary Fund (IMF), suggesting the global economy would grow more than expected. At the time of writing, WTI exchanges hands at $77.89, up 1.25%.
The IMF upward reviewed its forecast for the global economy, particularly the US and China, adding that a “soft landing” was in sight, though overall growth and global trade remain below the historical average.
On Monday, China’s property crisis concerns weighed on Oil prices as a Hong Kong court ordered the liquidation of property company China Evergrande Group.
In the meantime, the escalation of the Middle East conflict has boosted Oil prices. US President Joe Biden said the US “…will respond in an appropriate fashion, and it is very possible that what you’ll see is a tiered approach here, not just a single action, but essentially multiple actions.”
Aside from this, the Organization of Petroleum Exporting Countries (OPEC+) will meet on February 1, and isn’t expected to provide a decision on the cartel’s Oil supply for April.
Meanwhile, a Reuters poll suggested the US crude inventories were foreseen to have drawn down in the last week some 900K barrels.
WTI’s daily chart depicts Oil is neutrally biased, challenging the 200-day moving average (DMA) at $77.45 at the time of writing. If buyers keep prices above the latter, they could test the 100-day moving average (DMA) at $79.28. Once cleared, WTI would turn bullish, and resumes its uptrend toward $80.00. On the other hand, if sellers keep WTI price below the 200-DMA, that could pave the way to the 50-DMA at $73.58.
Technical Levels: Supports and Resistances
XTIUSD currently trading at 77.86 at the time of writing. Pair opened at 76.96 and is trading with a change of 1.17 % .
| Overview | Overview.1 | |
|---|---|---|
| 0 | Today last price | 77.86 |
| 1 | Today Daily Change | 0.90 |
| 2 | Today Daily Change % | 1.17 |
| 3 | Today daily open | 76.96 |
The pair is trading above its 20 Daily moving average @ 73.57, above its 50 Daily moving average @ 73.5 , below its 100 Daily moving average @ 78.91 and above its 200 Daily moving average @ 77.25
| Trends | Trends.1 | |
|---|---|---|
| 0 | Daily SMA20 | 73.57 |
| 1 | Daily SMA50 | 73.50 |
| 2 | Daily SMA100 | 78.91 |
| 3 | Daily SMA200 | 77.25 |
The previous day high was 79.19 while the previous day low was 76.38. The daily 38.2% Fib levels comes at 77.46, expected to provide support. Similarly, the daily 61.8% fib level is at 78.12, expected to provide resistance.
Note the levels of interest below:
- Pivot support is noted at 75.83, 74.7, 73.02
- Pivot resistance is noted at 78.64, 80.33, 81.46
| Levels | Levels.1 |
|---|---|
| Previous Daily High | 79.19 |
| Previous Daily Low | 76.38 |
| Previous Weekly High | 78.20 |
| Previous Weekly Low | 72.55 |
| Previous Monthly High | 76.79 |
| Previous Monthly Low | 67.97 |
| Daily Fibonacci 38.2% | 77.46 |
| Daily Fibonacci 61.8% | 78.12 |
| Daily Pivot Point S1 | 75.83 |
| Daily Pivot Point S2 | 74.70 |
| Daily Pivot Point S3 | 73.02 |
| Daily Pivot Point R1 | 78.64 |
| Daily Pivot Point R2 | 80.33 |
| Daily Pivot Point R3 | 81.46 |
[/s2If]
Nehcap Trading Strategies
The NEHCAP currently runs the following trading systems for clients. They can be bought and run on your funds.
The system is trading live: LIVE ACCOUNT TRACKING
Contact Us: Contact
The HFT_FIX can be run free for 2 weeks on any broker with a ECN. Apply for a free trial
Join Our Telegram Group
")


