WTI oil drops over 1.50%, affected by China’s property sector woes and a robust US Dollar. (Pivot Orderbook analysis)
…
This is a premium post.
[s2If !current_user_can(access_s2member_level4)]Please register for FREE REGISTER to read full post below containing analysis. In case of any error or you think you are not able to read the full post below, please email us at support#nehcap.com [lwa][/s2If] [s2If current_user_can(access_s2member_level1)]
- WTI oil drops over 1.50%, affected by China’s property sector woes and a robust US Dollar.
- Oil prices falter despite geopolitical tensions, pressured by global economic concerns and central bank policies.
- Market awaits API and EIA reports for insights on US crude and distillate stocks amid economic uncertainty.
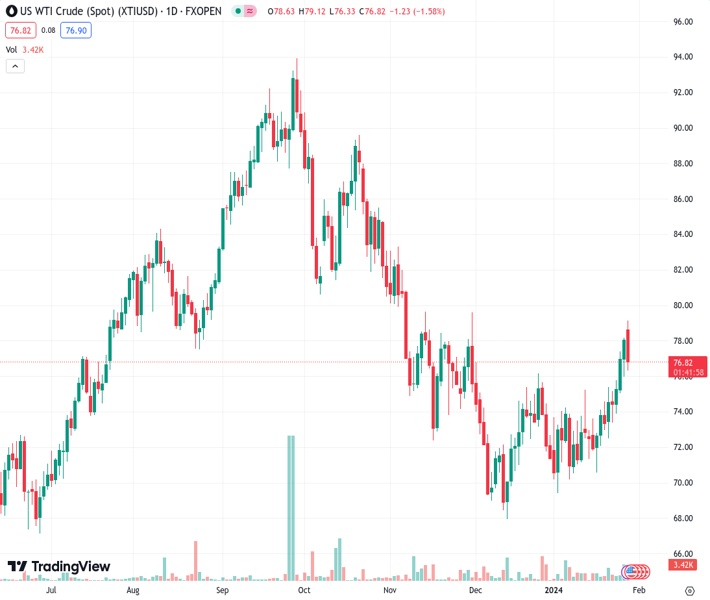
The pair currently trades last at 76.89.
The previous day high was 78.2 while the previous day low was 76.02. The daily 38.2% Fib levels comes at 77.36, expected to provide resistance. Similarly, the daily 61.8% fib level is at 76.85, expected to provide support.
West Texas Intermediate (WTI) drops sharply more than 1.50% on Monday, after failing to crack a key technical resistance level, along with demand woes sponsored by China’s property crisis. Despite rising tensions in the Middle East, traders are bracing for the US Federal Reserve (Fed) decision to keep the US Dollar strong. At the time of writing, WTI exchanges hands at $76.90.
The real estate crisis in China might be about to get worse as a Hong Kong court ordered the liquidation of property giant China Evergrande Group. Sources cited by Reuters said, “The situation in China is the biggest headwind to the whole market; that is why the market keeps backing off from the war risk premium.”
Oil prices failed to gain traction following an attack to a Russian oil facility on Monday on the Slavneft-YANOS refinery in the city of Yaroslavl.
In the meantime, the restrictiveness of global central banks keeps Oil prices slightly depressed as the Federal Reserve (Fed) and the Bank of England (BoE) take center stage during the week. Both central banks are expected to keep rates unchanged, though the former is underpinning the Greenback (USD).
The US Dollar Index (DXY), which tracks the performance of six currencies against the buck, is up 0.14%, at 103.61, a headwind for US Dollar denominated assets.
All in all, Oil traders are looking forward to the American Petroleum Institute (API) stockpiles report in the US on Tuesday, ahead of the US Energy Information Administration (EIA) on Wednesday.
According to a Reuters poll, US crude Oil and distillates are expected to have reduced last week, while gasoline inventoried were seen rising.
With WTI’s failing to crack the 100-day moving average (DMA) at $79.37, sellers piled in a comeback as Oil prices were dragged below the 200-DMA at $77.44, exacerbating the drop below $77.00 per barrel. A daily close below the latter will expose the $76.00 figure, followed by the 50-DMA at $73.54. Further downside is seen at $73.00. Conversely if buyers lift the price above $77.00, a test fo the 200-DMA is on the cards.
Technical Levels: Supports and Resistances
XTIUSD currently trading at 76.89 at the time of writing. Pair opened at 78.09 and is trading with a change of -1.54 % .
| Overview | Overview.1 | |
|---|---|---|
| 0 | Today last price | 76.89 |
| 1 | Today Daily Change | -1.20 |
| 2 | Today Daily Change % | -1.54 |
| 3 | Today daily open | 78.09 |
The pair is trading above its 20 Daily moving average @ 73.3, above its 50 Daily moving average @ 73.51 , below its 100 Daily moving average @ 79.01 and below its 200 Daily moving average @ 77.26
| Trends | Trends.1 | |
|---|---|---|
| 0 | Daily SMA20 | 73.30 |
| 1 | Daily SMA50 | 73.51 |
| 2 | Daily SMA100 | 79.01 |
| 3 | Daily SMA200 | 77.26 |
The previous day high was 78.2 while the previous day low was 76.02. The daily 38.2% Fib levels comes at 77.36, expected to provide resistance. Similarly, the daily 61.8% fib level is at 76.85, expected to provide support.
Note the levels of interest below:
- Pivot support is noted at 76.67, 75.25, 74.49
- Pivot resistance is noted at 78.85, 79.61, 81.03
| Levels | Levels.1 |
|---|---|
| Previous Daily High | 78.20 |
| Previous Daily Low | 76.02 |
| Previous Weekly High | 78.20 |
| Previous Weekly Low | 72.55 |
| Previous Monthly High | 76.79 |
| Previous Monthly Low | 67.97 |
| Daily Fibonacci 38.2% | 77.36 |
| Daily Fibonacci 61.8% | 76.85 |
| Daily Pivot Point S1 | 76.67 |
| Daily Pivot Point S2 | 75.25 |
| Daily Pivot Point S3 | 74.49 |
| Daily Pivot Point R1 | 78.85 |
| Daily Pivot Point R2 | 79.61 |
| Daily Pivot Point R3 | 81.03 |
[/s2If]
Nehcap Trading Strategies
The NEHCAP currently runs the following trading systems for clients. They can be bought and run on your funds.
The system is trading live: LIVE ACCOUNT TRACKING
Contact Us: Contact
The HFT_FIX can be run free for 2 weeks on any broker with a ECN. Apply for a free trial
Join Our Telegram Group
")


