WTI price receives upward support due to the expectation of a PBoC MLF rate cut. (Pivot Orderbook analysis)
…
This is a premium post.
[s2If !current_user_can(access_s2member_level4)]Please register for FREE REGISTER to read full post below containing analysis. In case of any error or you think you are not able to read the full post below, please email us at support#nehcap.com [lwa][/s2If] [s2If current_user_can(access_s2member_level1)]
- WTI price receives upward support due to the expectation of a PBoC MLF rate cut.
- EIA Crude Oil Stocks Change declined by 9.233M barrels compared to the previous drop of 2.492M barrels.
- US Baker Hughes anticipates a decline in spending on drilling in North America in 2024.
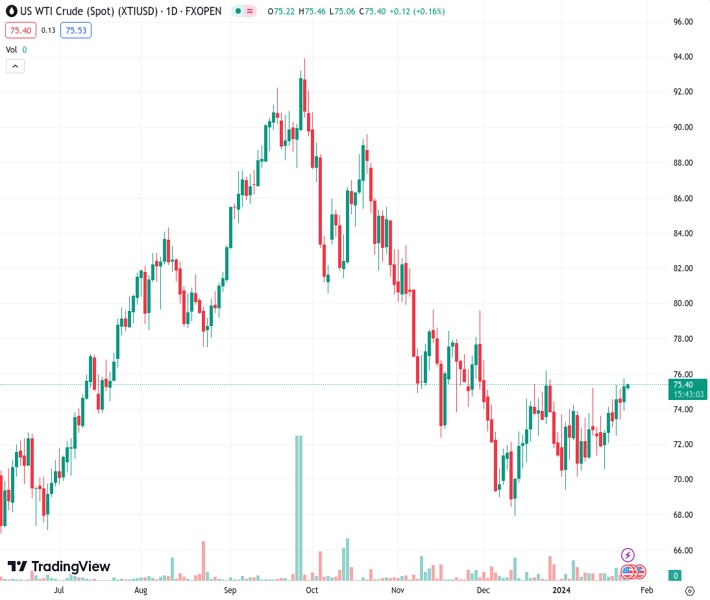
The pair currently trades last at 75.47.
The previous day high was 75.8 while the previous day low was 73.94. The daily 38.2% Fib levels comes at 75.09, expected to provide support. Similarly, the daily 61.8% fib level is at 74.65, expected to provide support.
West Texas Intermediate (WTI) oil price grapples to continue its gains for the second consecutive session. The strength in the Crude oil prices is attributed to the recent development of the Medium-term Lending Facility (MLF) rate cut, along with the decline in the US Crude Oil stockpiles. The WTI oil price inches higher near $75.50 per barrel during the Asian session on Thursday.
The People’s Bank of China (PBoC) is speculated to consider cutting the Medium-term Lending Facility (MLF) rate in the current quarter. This anticipation follows the recent announcement by PBoC Governor Pan Gongsheng, informing about a reduction of the Required Reserve Ratio (RRR) by 50 basis points starting from February 5th.
A potential cut in the MLF rate, coupled with the RRR reduction, is expected to provide additional liquidity and support economic growth. This, in turn, could stimulate consumption, including the consumption of crude oil products, by China, which is the world’s largest oil importer.
According to the Energy Information Administration’s (EIA) weekly report released on Wednesday, Crude Oil Stocks Change experienced a significant decline of 9.233 million barrels for the week ending on January 19. This marks a substantial decrease compared to the previous week’s reading, which reported a drop of 2.492 million barrels. Severe weather conditions, such as storms and cold snaps disrupted Crude oil production and transportation particularly in North Dakota, leading to fluctuations in inventory levels.
US oilfield technology firm Baker Hughes has stated that it anticipates a decline in spending on drilling and well completion in North America in 2024, citing ongoing volatility in commodity prices. The company’s outlook reflects the cautious approach of shale producers, who are seeking to reduce drilling activities in response to weak prices in the oil market.
Technical Levels: Supports and Resistances
XTIUSD currently trading at 75.47 at the time of writing. Pair opened at 75.43 and is trading with a change of 0.05 % .
| Overview | Overview.1 | |
|---|---|---|
| 0 | Today last price | 75.47 |
| 1 | Today Daily Change | 0.04 |
| 2 | Today Daily Change % | 0.05 |
| 3 | Today daily open | 75.43 |
The pair is trading above its 20 Daily moving average @ 72.71, above its 50 Daily moving average @ 73.39 , below its 100 Daily moving average @ 79.19 and below its 200 Daily moving average @ 77.26
| Trends | Trends.1 | |
|---|---|---|
| 0 | Daily SMA20 | 72.71 |
| 1 | Daily SMA50 | 73.39 |
| 2 | Daily SMA100 | 79.19 |
| 3 | Daily SMA200 | 77.26 |
The previous day high was 75.8 while the previous day low was 73.94. The daily 38.2% Fib levels comes at 75.09, expected to provide support. Similarly, the daily 61.8% fib level is at 74.65, expected to provide support.
Note the levels of interest below:
- Pivot support is noted at 74.32, 73.2, 72.46
- Pivot resistance is noted at 76.17, 76.92, 78.03
| Levels | Levels.1 |
|---|---|
| Previous Daily High | 75.80 |
| Previous Daily Low | 73.94 |
| Previous Weekly High | 74.60 |
| Previous Weekly Low | 70.63 |
| Previous Monthly High | 76.79 |
| Previous Monthly Low | 67.97 |
| Daily Fibonacci 38.2% | 75.09 |
| Daily Fibonacci 61.8% | 74.65 |
| Daily Pivot Point S1 | 74.32 |
| Daily Pivot Point S2 | 73.20 |
| Daily Pivot Point S3 | 72.46 |
| Daily Pivot Point R1 | 76.17 |
| Daily Pivot Point R2 | 76.92 |
| Daily Pivot Point R3 | 78.03 |
[/s2If]
Nehcap Trading Strategies
The NEHCAP currently runs the following trading systems for clients. They can be bought and run on your funds.
The system is trading live: LIVE ACCOUNT TRACKING
Contact Us: Contact
The HFT_FIX can be run free for 2 weeks on any broker with a ECN. Apply for a free trial
Join Our Telegram Group
")


