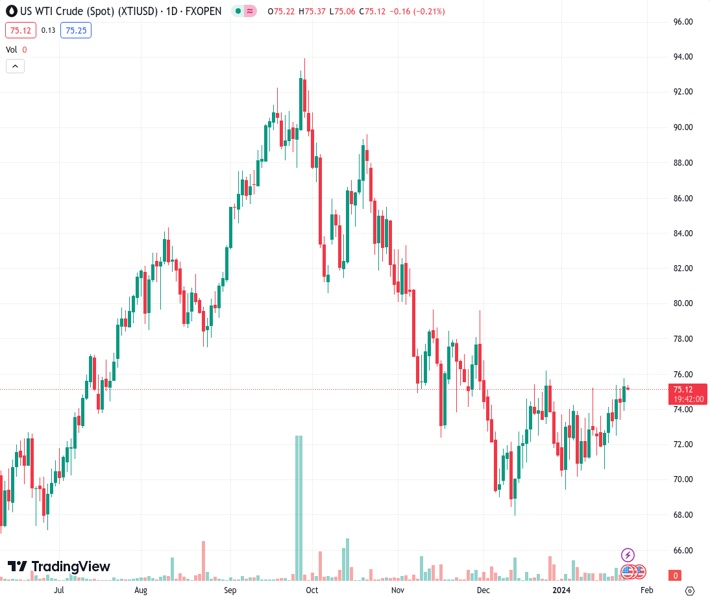
WTI drops to $75.15 amid the modest recovery in the US Dollar. (Pivot Orderbook analysis)
…
This is a premium post.
[s2If !current_user_can(access_s2member_level4)]Please register for FREE REGISTER to read full post below containing analysis. In case of any error or you think you are not able to read the full post below, please email us at support#nehcap.com [lwa][/s2If] [s2If current_user_can(access_s2member_level1)]
- WTI drops to $75.15 amid the modest recovery in the US Dollar.
- US crude oil inventories fell by 9.233M barrels last week due to severe winter storms.
- The PBoC announces the biggest cut in banks’ reserve ratios for two years from February 5.
- Oil traders will closely watch the flash US Gross Domestic Product Annualized (Q4), due on Thursday.
The pair currently trades last at 75.19.
The previous day high was 75.8 while the previous day low was 73.94. The daily 38.2% Fib levels comes at 75.09, expected to provide support. Similarly, the daily 61.8% fib level is at 74.65, expected to provide support.
Western Texas Intermediate (WTI), the US crude oil benchmark, is trading around $75.15 on Thursday. WTI prices edge lower 0.37% on the day amid renewed US Dollar (USD) demand. However, a slump in US crude output, new Chinese stimulus measures, and geopolitical tensions might cap the downside of the black gold.
According to the Energy Information Agency’s (EIA) weekly report on Wednesday, US crude oil inventories fell by 9.233M barrels for the week ending January 19 from the previous reading of 2.493M barrels drop. A winter storm hit US oil output last week, particularly in North Dakota, the third-largest crude-producing state in the US.
The People’s Bank of China (PBoC) will cut the amount of cash that banks are required to hold as reserves from February 5, the biggest cut for more than two years. This measure is likely to strengthen a fragile economic recovery. This, in turn, might boost WTI prices as China is the world’s largest oil importer.
Meanwhile, the geopolitical risk in the Red Sea is largely already factored into prices. The United States and UK have conducted numerous rounds of airstrikes in Yemen against Houthi militants, who continue to attack shipping ships in the Red Sea.
Oil traders will keep an eye on the preliminary US Gross Domestic Product Annualized (Q4), which is estimated to expand by 2.0%. The attention will shift to the US Core Personal Consumption Expenditures Price Index (Core PCE) on Friday. These events could significantly impact the USD-denominated WTI price. Oil traders will take cues from the data and find trading opportunities around WTI prices.
Technical Levels: Supports and Resistances
XTIUSD currently trading at 75.19 at the time of writing. Pair opened at 75.43 and is trading with a change of -0.32 % .
| Overview | Overview.1 | |
|---|---|---|
| 0 | Today last price | 75.19 |
| 1 | Today Daily Change | -0.24 |
| 2 | Today Daily Change % | -0.32 |
| 3 | Today daily open | 75.43 |
The pair is trading above its 20 Daily moving average @ 72.71, above its 50 Daily moving average @ 73.39 , below its 100 Daily moving average @ 79.19 and below its 200 Daily moving average @ 77.26
| Trends | Trends.1 | |
|---|---|---|
| 0 | Daily SMA20 | 72.71 |
| 1 | Daily SMA50 | 73.39 |
| 2 | Daily SMA100 | 79.19 |
| 3 | Daily SMA200 | 77.26 |
The previous day high was 75.8 while the previous day low was 73.94. The daily 38.2% Fib levels comes at 75.09, expected to provide support. Similarly, the daily 61.8% fib level is at 74.65, expected to provide support.
Note the levels of interest below:
- Pivot support is noted at 74.32, 73.2, 72.46
- Pivot resistance is noted at 76.17, 76.92, 78.03
| Levels | Levels.1 |
|---|---|
| Previous Daily High | 75.80 |
| Previous Daily Low | 73.94 |
| Previous Weekly High | 74.60 |
| Previous Weekly Low | 70.63 |
| Previous Monthly High | 76.79 |
| Previous Monthly Low | 67.97 |
| Daily Fibonacci 38.2% | 75.09 |
| Daily Fibonacci 61.8% | 74.65 |
| Daily Pivot Point S1 | 74.32 |
| Daily Pivot Point S2 | 73.20 |
| Daily Pivot Point S3 | 72.46 |
| Daily Pivot Point R1 | 76.17 |
| Daily Pivot Point R2 | 76.92 |
| Daily Pivot Point R3 | 78.03 |
[/s2If]
Nehcap Trading Strategies
The NEHCAP currently runs the following trading systems for clients. They can be bought and run on your funds.
The system is trading live: LIVE ACCOUNT TRACKING
Contact Us: Contact
The HFT_FIX can be run free for 2 weeks on any broker with a ECN. Apply for a free trial
Join Our Telegram Group
")


