Energy markets bid up Crude Oil after US supplies declined more than expected. (Pivot Orderbook analysis)
…
This is a premium post.
[s2If !current_user_can(access_s2member_level4)]Please register for FREE REGISTER to read full post below containing analysis. In case of any error or you think you are not able to read the full post below, please email us at support#nehcap.com [lwa][/s2If] [s2If current_user_can(access_s2member_level1)]
- Energy markets bid up Crude Oil after US supplies declined more than expected.
- EIA reported a steep drawdown in US crude stocks, but another buildup in refined gasoline.
- Cold weather hampered Crude oil logistics, China stimulus expected to drive demand higher.
The pair currently trades last at 75.32.
The previous day high was 75.21 while the previous day low was 73.4. The daily 38.2% Fib levels comes at 74.09, expected to provide support. Similarly, the daily 61.8% fib level is at 74.52, expected to provide support.
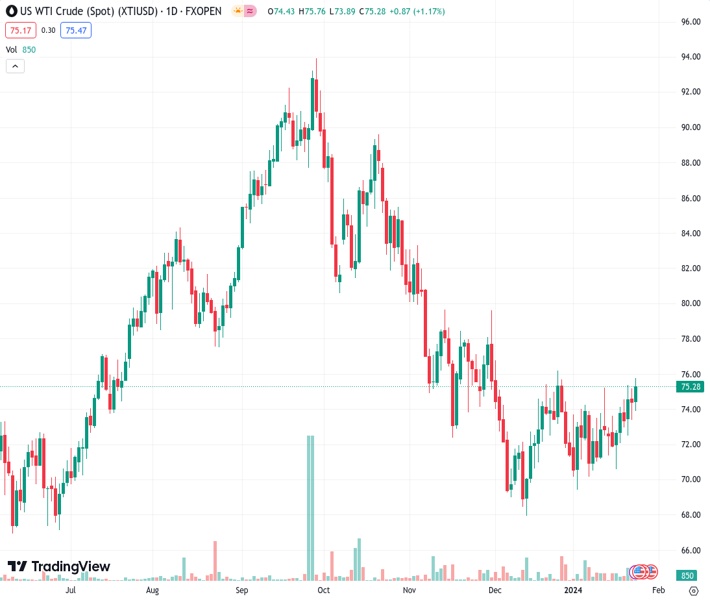
Crude Oil markets climbed on Wednesday, sending West Texas Intermediate (WTI) into its highest bids in almost six weeks after the Energy Information Administration (EIA) revealed a steeper-than-expected drawdown in US barrel supplies.
China is expected to add additional stimulus to the domestic Chinese economy and reduce the reserve requirements for local banks in an effort to jumpstart flagging business activity. Barrel traders expect the additional business spending to pump up demand for Crude Oil in China.
The EIA reported a surprise drawdown of over 9 million barrels of US Crude Oil Inventories, owing in large part to a recent cold snap that limited logistics and deliveries in several key areas. Despite the drawdown in Crude Oil supplies, energies are shrugging off another surprise buildup in gasoline inventories of 4.913 million barrels of refined gasoline versus the forecast 2 million barrel buildup, adding even further to the previous week’s 3.083 million barrels.
WTI Crude Oil climbed above $75.50, setting an intraday high of $75.80 before slipping back to continue testing just above the $75.00 handle. US Crude Oil continues to find technical support from the 200-hour Simple Moving Average (SMA) near $73.50, and near-term technical continue to lean bullish.
Daily candlesticks show a possible technical ceiling at the 200-day SMA near the $78.00 handle as WTI drifts into a congestion zone between the 200-day SMA and a bearish 50-day SMA just below $74.00.
Technical Levels: Supports and Resistances
XTIUSD currently trading at 75.32 at the time of writing. Pair opened at 74.5 and is trading with a change of 1.1 % .
| Overview | Overview.1 | |
|---|---|---|
| 0 | Today last price | 75.32 |
| 1 | Today Daily Change | 0.82 |
| 2 | Today Daily Change % | 1.10 |
| 3 | Today daily open | 74.50 |
The pair is trading above its 20 Daily moving average @ 72.63, above its 50 Daily moving average @ 73.41 , below its 100 Daily moving average @ 79.3 and below its 200 Daily moving average @ 77.27
| Trends | Trends.1 | |
|---|---|---|
| 0 | Daily SMA20 | 72.63 |
| 1 | Daily SMA50 | 73.41 |
| 2 | Daily SMA100 | 79.30 |
| 3 | Daily SMA200 | 77.27 |
The previous day high was 75.21 while the previous day low was 73.4. The daily 38.2% Fib levels comes at 74.09, expected to provide support. Similarly, the daily 61.8% fib level is at 74.52, expected to provide support.
Note the levels of interest below:
- Pivot support is noted at 73.53, 72.56, 71.72
- Pivot resistance is noted at 75.34, 76.18, 77.16
| Levels | Levels.1 |
|---|---|
| Previous Daily High | 75.21 |
| Previous Daily Low | 73.40 |
| Previous Weekly High | 74.60 |
| Previous Weekly Low | 70.63 |
| Previous Monthly High | 76.79 |
| Previous Monthly Low | 67.97 |
| Daily Fibonacci 38.2% | 74.09 |
| Daily Fibonacci 61.8% | 74.52 |
| Daily Pivot Point S1 | 73.53 |
| Daily Pivot Point S2 | 72.56 |
| Daily Pivot Point S3 | 71.72 |
| Daily Pivot Point R1 | 75.34 |
| Daily Pivot Point R2 | 76.18 |
| Daily Pivot Point R3 | 77.16 |
[/s2If]
Nehcap Trading Strategies
The NEHCAP currently runs the following trading systems for clients. They can be bought and run on your funds.
The system is trading live: LIVE ACCOUNT TRACKING
Contact Us: Contact
The HFT_FIX can be run free for 2 weeks on any broker with a ECN. Apply for a free trial
Join Our Telegram Group
")


