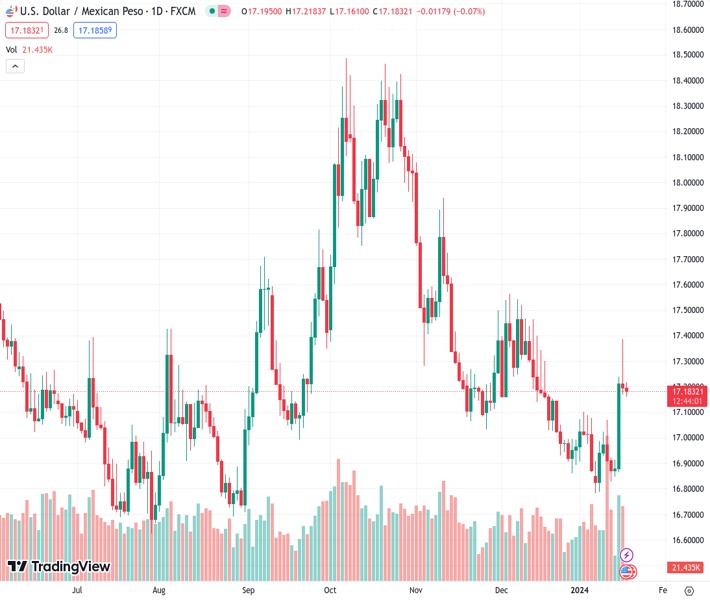
#USDMXN @ 17.1822 retraces its recent losses on risk aversion sentiment. (Pivot Orderbook analysis)
…
This is a premium post.
[s2If !current_user_can(access_s2member_level4)]Please register for FREE REGISTER to read full post below containing analysis. In case of any error or you think you are not able to read the full post below, please email us at support#nehcap.com [lwa][/s2If] [s2If current_user_can(access_s2member_level1)]
- USD/MXN retraces its recent losses on risk aversion sentiment.
- The upcoming Mexico and the US elections could exert pressure on the MXN.
- US Dollar recovers its intraday losses despite downbeat US bond yields.
The pair currently trades last at 17.1822.
The previous day high was 17.3871 while the previous day low was 17.2005. The daily 38.2% Fib levels comes at 17.3158, expected to provide resistance. Similarly, the daily 61.8% fib level is at 17.2718, expected to provide resistance.
USD/MXN retraces its recent losses, which could be attributed to the risk aversion sentiment in the market. The USD/MXN pair trades higher near 17.21 during the European session on Thursday. The analysis from TD Securities indicates that the performance of the Mexican Peso (MXN) is largely influenced by factors related to the United States (US). The returns on MXN appear to be primarily explained by US and global macroeconomic conditions.
Consequently, if there is a slowdown in the US economy and the US Federal Reserve (Fed) embarks on an aggressive cutting cycle in 2024, it could prompt markets to factor in more rate cuts by the Bank of Mexico (Banxico), potentially leading to underperformance of the Mexican Peso.
Moreover, the upcoming 2024 elections in both Mexico and the US are anticipated to introduce additional uncertainties and volatility, potentially exerting further pressure on the performance of the Mexican Peso.
Mexico’s economic calendar lacked notable events during the week, and market participants anticipate the release of November’s Retail Sales data. Projections suggest month-over-month and year-over-year ease at 0.5% and 3.2%, respectively, falling short of the previous figures.
The US Dollar (USD) recovers its intraday losses, trading around 103.30 despite the subdued US Treasury yields. As of the press time, the 2-year and 10-year yields are standing at 4.32% and 4.08%, respectively.
The US Dollar continues to receive support from positive investor sentiment, as expectations for the Federal Reserve’s (Fed) initial rate cut in March have diminished. This adjustment is reinforced by robust US Retail Sales data released on Wednesday.
Market participants are expected to closely monitor the upcoming release of US housing data scheduled for Thursday, which could provide further insights into the economic landscape and influence the direction of the USD/MXN pair.
Technical Levels: Supports and Resistances
USDMXN currently trading at 17.2056 at the time of writing. Pair opened at 17.2312 and is trading with a change of -0.15 % .
| Overview | Overview.1 | |
|---|---|---|
| 0 | Today last price | 17.2056 |
| 1 | Today Daily Change | -0.0256 |
| 2 | Today Daily Change % | -0.1500 |
| 3 | Today daily open | 17.2312 |
The pair is trading above its 20 Daily moving average @ 16.9838, above its 50 Daily moving average @ 17.1722 , below its 100 Daily moving average @ 17.4262 and below its 200 Daily moving average @ 17.375
| Trends | Trends.1 | |
|---|---|---|
| 0 | Daily SMA20 | 16.9838 |
| 1 | Daily SMA50 | 17.1722 |
| 2 | Daily SMA100 | 17.4262 |
| 3 | Daily SMA200 | 17.3750 |
The previous day high was 17.3871 while the previous day low was 17.2005. The daily 38.2% Fib levels comes at 17.3158, expected to provide resistance. Similarly, the daily 61.8% fib level is at 17.2718, expected to provide resistance.
Note the levels of interest below:
- Pivot support is noted at 17.1588, 17.0864, 16.9722
- Pivot resistance is noted at 17.3454, 17.4595, 17.532
| Levels | Levels.1 |
|---|---|
| Previous Daily High | 17.3871 |
| Previous Daily Low | 17.2005 |
| Previous Weekly High | 17.0643 |
| Previous Weekly Low | 16.7842 |
| Previous Monthly High | 17.5653 |
| Previous Monthly Low | 16.8611 |
| Daily Fibonacci 38.2% | 17.3158 |
| Daily Fibonacci 61.8% | 17.2718 |
| Daily Pivot Point S1 | 17.1588 |
| Daily Pivot Point S2 | 17.0864 |
| Daily Pivot Point S3 | 16.9722 |
| Daily Pivot Point R1 | 17.3454 |
| Daily Pivot Point R2 | 17.4595 |
| Daily Pivot Point R3 | 17.5320 |
[/s2If]
Nehcap Trading Strategies
The NEHCAP currently runs the following trading systems for clients. They can be bought and run on your funds.
The system is trading live: LIVE ACCOUNT TRACKING
Contact Us: Contact
The HFT_FIX can be run free for 2 weeks on any broker with a ECN. Apply for a free trial
Join Our Telegram Group
")


