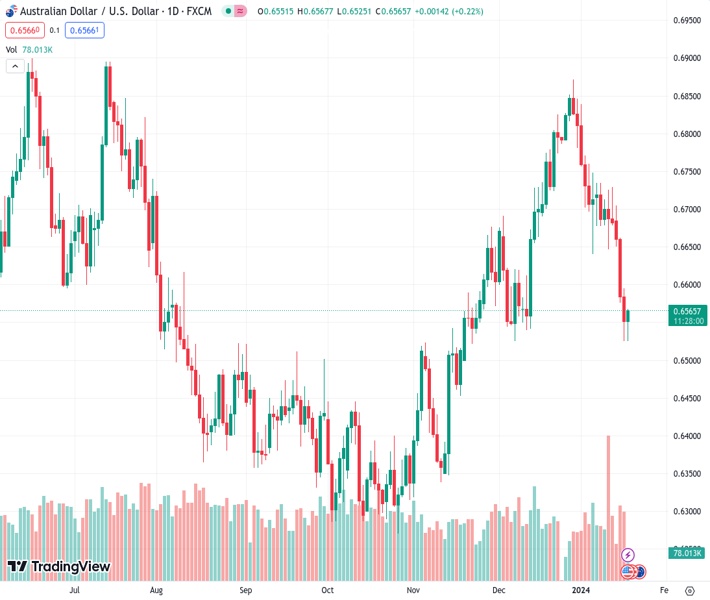
#AUDUSD @ 0.65671 The Aussie has trimmed some losses on the back of a softer dollar but the broader bearish trend remains intact (Pivot Orderbook analysis)
…
This is a premium post.
[s2If !current_user_can(access_s2member_level4)]Please register for FREE REGISTER to read full post below containing analysis. In case of any error or you think you are not able to read the full post below, please email us at support#nehcap.com [lwa][/s2If] [s2If current_user_can(access_s2member_level1)]
- The Aussie has trimmed some losses on the back of a softer dollar but the broader bearish trend remains intact
- Australian data has shown mixed figures, the focus is now on US housing and jobless claims figures.
- AUD/USD is likely to meet resistance at 0.6545 and 0.6640.
The pair currently trades last at 0.65671.
The previous day high was 0.6595 while the previous day low was 0.6525. The daily 38.2% Fib levels comes at 0.6552, expected to provide support. Similarly, the daily 61.8% fib level is at 0.6568, expected to provide resistance.
The Australian Dollar is going through a mild recovery on Thursday, favored by a softer US Dollar. The pair has trimmed some losses, returning above 0.6550, although the broader trend remains negative.
Australian data has been mixed. The Consumer Inflation Expectations remained steady at 4.5% in January while the number of employed workers declined unexpectedly, suggesting that the labour market is losing steam.
Macroeconomic data from China released on Wednesday showed that the GDP grew at a 5.2% rate in 2023, below market expectations of a 5.3% growth. Beyond that, retail sales disappointed, reviving concerns about the sluggish post-COVID recovery and weighing on the Aussie as China is Australia’s main trading partner.
From a wider perspective, the AUD/USD maintains the negative bias intact with the bearish cross in 4h SMAs adding weight to the pair. Aussie bulls are likely to find resistance at 0.6595 and 0.6640. On the downside, supports are 0.6520 and 0.6450.
Technical Levels: Supports and Resistances
AUDUSD currently trading at 0.6564 at the time of writing. Pair opened at 0.655 and is trading with a change of 0.21 % .
| Overview | Overview.1 | |
|---|---|---|
| 0 | Today last price | 0.6564 |
| 1 | Today Daily Change | 0.0014 |
| 2 | Today Daily Change % | 0.2100 |
| 3 | Today daily open | 0.6550 |
The pair is trading below its 20 Daily moving average @ 0.6735, below its 50 Daily moving average @ 0.6641 , above its 100 Daily moving average @ 0.6517 and below its 200 Daily moving average @ 0.6583
| Trends | Trends.1 | |
|---|---|---|
| 0 | Daily SMA20 | 0.6735 |
| 1 | Daily SMA50 | 0.6641 |
| 2 | Daily SMA100 | 0.6517 |
| 3 | Daily SMA200 | 0.6583 |
The previous day high was 0.6595 while the previous day low was 0.6525. The daily 38.2% Fib levels comes at 0.6552, expected to provide support. Similarly, the daily 61.8% fib level is at 0.6568, expected to provide resistance.
Note the levels of interest below:
- Pivot support is noted at 0.6518, 0.6487, 0.6449
- Pivot resistance is noted at 0.6588, 0.6626, 0.6658
| Levels | Levels.1 |
|---|---|
| Previous Daily High | 0.6595 |
| Previous Daily Low | 0.6525 |
| Previous Weekly High | 0.6735 |
| Previous Weekly Low | 0.6647 |
| Previous Monthly High | 0.6871 |
| Previous Monthly Low | 0.6526 |
| Daily Fibonacci 38.2% | 0.6552 |
| Daily Fibonacci 61.8% | 0.6568 |
| Daily Pivot Point S1 | 0.6518 |
| Daily Pivot Point S2 | 0.6487 |
| Daily Pivot Point S3 | 0.6449 |
| Daily Pivot Point R1 | 0.6588 |
| Daily Pivot Point R2 | 0.6626 |
| Daily Pivot Point R3 | 0.6658 |
[/s2If]
Nehcap Trading Strategies
The NEHCAP currently runs the following trading systems for clients. They can be bought and run on your funds.
The system is trading live: LIVE ACCOUNT TRACKING
Contact Us: Contact
The HFT_FIX can be run free for 2 weeks on any broker with a ECN. Apply for a free trial
Join Our Telegram Group
")


