#EURUSD @ 1.09196 loses traction below the mid-1.0900s amid the geopolitical tension in the Red Sea. (Pivot Orderbook analysis)
…
This is a premium post.
[s2If !current_user_can(access_s2member_level4)]Please register for FREE REGISTER to read full post below containing analysis. In case of any error or you think you are not able to read the full post below, please email us at support#nehcap.com [lwa][/s2If] [s2If current_user_can(access_s2member_level1)]
- EUR/USD loses traction below the mid-1.0900s amid the geopolitical tension in the Red Sea.
- Eurozone Industrial Production dropped 0.3% MoM in November from a 0.7% fall in October.
- A dovish remarks from the Federal Reserve (Fed) might cap the USD’s upside.
- Investors will closely watch the Eurozone Consumer Price Index (CPI) report, due on Tuesday.
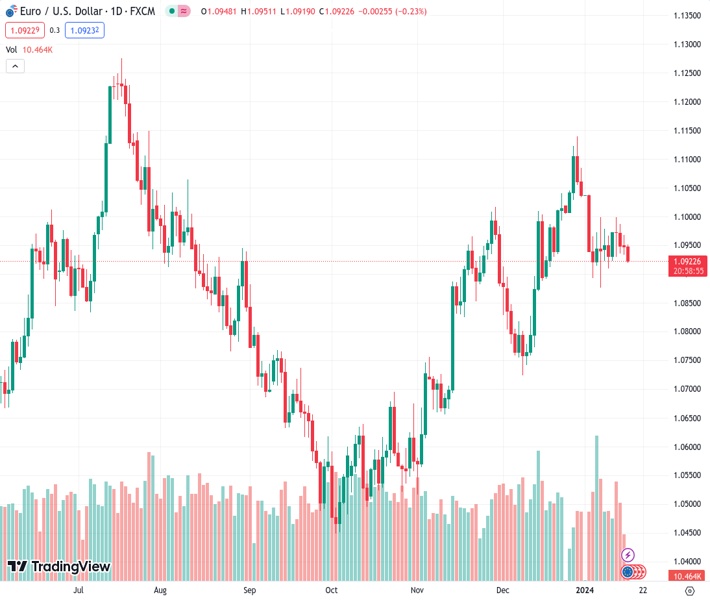
The pair currently trades last at 1.09196.
The previous day high was 1.0967 while the previous day low was 1.0934. The daily 38.2% Fib levels comes at 1.0955, expected to provide resistance. Similarly, the daily 61.8% fib level is at 1.0946, expected to provide resistance.
The EUR/USD pair trades weaker for the fourth consecutive day during the early Asian session on Tuesday. The risk-off mood in the market drags risky assets like the Euro (EUR) lower amid the rising tension in the Red Sea. The major pair currently trades near 1.0938, losing 0.12% on the day. Later on Tuesday, the German inflation data and the ZEW Survey will be released.
Eurostat revealed on Monday that the Industrial Production across the euro area remains weak. The figure came in at -0.3% MoM in November from -0.7% in the previous reading. On an annual basis, Industrial Production fell 6.8% YoY in November from the previous reading of a 6.6% drop. The Production figure fell in both Germany and Italy, which exerts some selling pressure on the EUR and acts as a headwind for the EUR/USD pair.
Additionally, the European Central Bank (ECB) policymaker Joachim Nagel said on Monday that it’s premature for the central bank to discuss cutting interest rates because inflation remains high. Nagel added that they may need to wait for new data, and interest rate decisions would be made on a meeting-by-meeting basis.
Across the pond, a dovish tilt in the Federal Reserve’s (Fed) stance might cap the upside in the US Dollar (USD). The Fed policy rate currently stands in the 5.25%–5.50% range after 525 basis points (bps) of rate hikes since March 2022. Investors anticipate rate cuts coming as early as March 2024.
Moving on, market players will keep an eye on the German inflation data on Tuesday, as measured by the Consumer Price Index (CPI) for December. Also, the ZEW Survey from Germany and the Eurozone will be published. On the US docket, the January US NY Empire State Manufacturing Index will be due and Fed’s Christopher J. Waller is set to speak later in the day.
Technical Levels: Supports and Resistances
EURUSD currently trading at 1.0932 at the time of writing. Pair opened at 1.0952 and is trading with a change of -0.18 % .
| Overview | Overview.1 | |
|---|---|---|
| 0 | Today last price | 1.0932 |
| 1 | Today Daily Change | -0.0020 |
| 2 | Today Daily Change % | -0.1800 |
| 3 | Today daily open | 1.0952 |
The pair is trading below its 20 Daily moving average @ 1.0985, above its 50 Daily moving average @ 1.0902 , above its 100 Daily moving average @ 1.0769 and above its 200 Daily moving average @ 1.0848
| Trends | Trends.1 | |
|---|---|---|
| 0 | Daily SMA20 | 1.0985 |
| 1 | Daily SMA50 | 1.0902 |
| 2 | Daily SMA100 | 1.0769 |
| 3 | Daily SMA200 | 1.0848 |
The previous day high was 1.0967 while the previous day low was 1.0934. The daily 38.2% Fib levels comes at 1.0955, expected to provide resistance. Similarly, the daily 61.8% fib level is at 1.0946, expected to provide resistance.
Note the levels of interest below:
- Pivot support is noted at 1.0934, 1.0917, 1.09
- Pivot resistance is noted at 1.0968, 1.0985, 1.1002
| Levels | Levels.1 |
|---|---|
| Previous Daily High | 1.0967 |
| Previous Daily Low | 1.0934 |
| Previous Weekly High | 1.1004 |
| Previous Weekly Low | 1.0910 |
| Previous Monthly High | 1.1140 |
| Previous Monthly Low | 1.0724 |
| Daily Fibonacci 38.2% | 1.0955 |
| Daily Fibonacci 61.8% | 1.0946 |
| Daily Pivot Point S1 | 1.0934 |
| Daily Pivot Point S2 | 1.0917 |
| Daily Pivot Point S3 | 1.0900 |
| Daily Pivot Point R1 | 1.0968 |
| Daily Pivot Point R2 | 1.0985 |
| Daily Pivot Point R3 | 1.1002 |
[/s2If]
Nehcap Trading Strategies
The NEHCAP currently runs the following trading systems for clients. They can be bought and run on your funds.
The system is trading live: LIVE ACCOUNT TRACKING
Contact Us: Contact
The HFT_FIX can be run free for 2 weeks on any broker with a ECN. Apply for a free trial
Join Our Telegram Group
")


