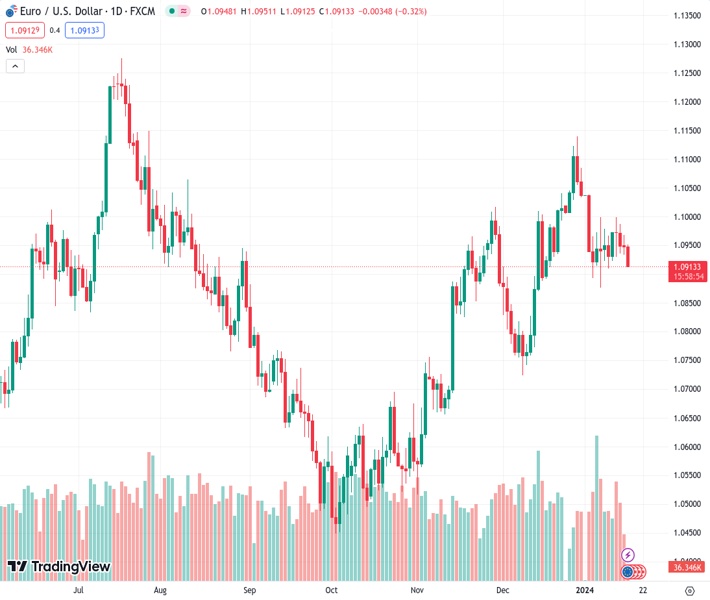
#EURUSD @ 1.09148 retraces its recent gains as the US Dollar gains ground on risk aversion. (Pivot Orderbook analysis)
…
This is a premium post.
[s2If !current_user_can(access_s2member_level4)]Please register for FREE REGISTER to read full post below containing analysis. In case of any error or you think you are not able to read the full post below, please email us at support#nehcap.com [lwa][/s2If] [s2If current_user_can(access_s2member_level1)]
- EUR/USD retraces its recent gains as the US Dollar gains ground on risk aversion.
- MACD indicates a momentum shift towards a bearish sentiment in the pair.
- The psychological level at 1.0900 and the 50-day EMA at 1.0897 could act as a potential support region.
The pair currently trades last at 1.09148.
The previous day high was 1.0967 while the previous day low was 1.0934. The daily 38.2% Fib levels comes at 1.0955, expected to provide resistance. Similarly, the daily 61.8% fib level is at 1.0946, expected to provide resistance.
EUR/USD trades lower near 1.0910 during the Asian session on Tuesday as US Dollar (USD) gains ground on risk aversion sentiment and upbeat US bond yields. The 14-day Relative Strength Index (RSI) for the EUR/USD pair is positioned below the 50 mark, indicating a bearish momentum in the market.
The Moving Average Convergence Divergence (MACD) line, despite being situated above the centerline, is diverging below the signal line. This suggests a potential shift in momentum towards a downward trend for the EUR/USD pair. Traders are expected to approach the situation with caution and may prefer to await confirmation before making trading decisions in the pair. It is important to consider the signals provided by this lagging indicator when assessing the market conditions.
The psychological level at 1.0900 could act as an immediate support aligned with the 50-day Exponential Moving Average (EMA) at 1.0897. A break below the support zone could put pressure on the EUR/USD pair to navigate the further region around the 38.2% Fibonacci retracement at 1.0867 level followed by the major support at 1.0850 level.
On the upside, the major level at 1.0950 appears to be the key resistance. A breakthrough above the latter could inspire the EUR/USD pair’s bulls to explore the region around the psychological level at 1.1000 followed by January’s high at 1.1038.
Technical Levels: Supports and Resistances
EURUSD currently trading at 1.0913 at the time of writing. Pair opened at 1.0952 and is trading with a change of -0.36 % .
| Overview | Overview.1 | |
|---|---|---|
| 0 | Today last price | 1.0913 |
| 1 | Today Daily Change | -0.0039 |
| 2 | Today Daily Change % | -0.3600 |
| 3 | Today daily open | 1.0952 |
The pair is trading below its 20 Daily moving average @ 1.0985, above its 50 Daily moving average @ 1.0902 , above its 100 Daily moving average @ 1.0769 and above its 200 Daily moving average @ 1.0848
| Trends | Trends.1 | |
|---|---|---|
| 0 | Daily SMA20 | 1.0985 |
| 1 | Daily SMA50 | 1.0902 |
| 2 | Daily SMA100 | 1.0769 |
| 3 | Daily SMA200 | 1.0848 |
The previous day high was 1.0967 while the previous day low was 1.0934. The daily 38.2% Fib levels comes at 1.0955, expected to provide resistance. Similarly, the daily 61.8% fib level is at 1.0946, expected to provide resistance.
Note the levels of interest below:
- Pivot support is noted at 1.0934, 1.0917, 1.09
- Pivot resistance is noted at 1.0968, 1.0985, 1.1002
| Levels | Levels.1 |
|---|---|
| Previous Daily High | 1.0967 |
| Previous Daily Low | 1.0934 |
| Previous Weekly High | 1.1004 |
| Previous Weekly Low | 1.0910 |
| Previous Monthly High | 1.1140 |
| Previous Monthly Low | 1.0724 |
| Daily Fibonacci 38.2% | 1.0955 |
| Daily Fibonacci 61.8% | 1.0946 |
| Daily Pivot Point S1 | 1.0934 |
| Daily Pivot Point S2 | 1.0917 |
| Daily Pivot Point S3 | 1.0900 |
| Daily Pivot Point R1 | 1.0968 |
| Daily Pivot Point R2 | 1.0985 |
| Daily Pivot Point R3 | 1.1002 |
[/s2If]
Nehcap Trading Strategies
The NEHCAP currently runs the following trading systems for clients. They can be bought and run on your funds.
The system is trading live: LIVE ACCOUNT TRACKING
Contact Us: Contact
The HFT_FIX can be run free for 2 weeks on any broker with a ECN. Apply for a free trial
Join Our Telegram Group
")


