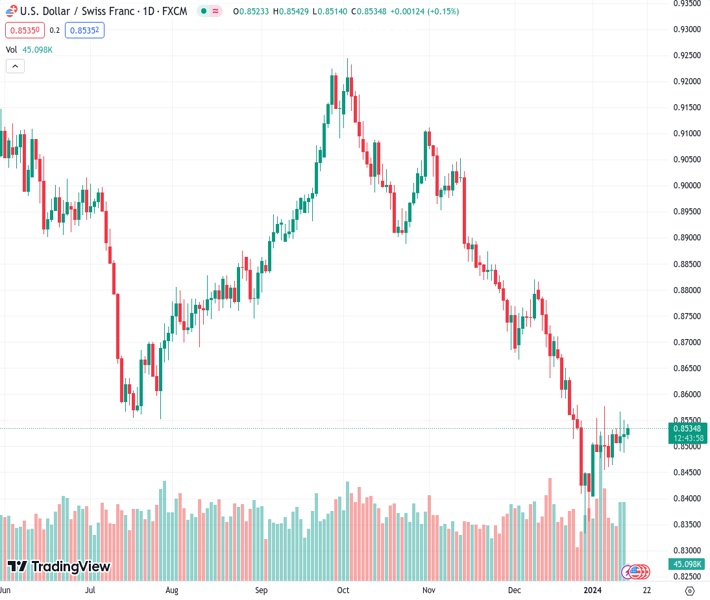
#USDCHF @ 0.85360 treads water to continue its winning streak as the US Dollar improves. (Pivot Orderbook analysis)
…
This is a premium post.
[s2If !current_user_can(access_s2member_level4)]Please register for FREE REGISTER to read full post below containing analysis. In case of any error or you think you are not able to read the full post below, please email us at support#nehcap.com [lwa][/s2If] [s2If current_user_can(access_s2member_level1)]
- USD/CHF treads water to continue its winning streak as the US Dollar improves.
- The escalated concern in the Red Sea could have supported the safe-haven CHF.
- The 28,000 leaders are expected to participate in the 54th World Economic Forum Annual Meeting in Davos.
The pair currently trades last at 0.85360.
The previous day high was 0.8551 while the previous day low was 0.8489. The daily 38.2% Fib levels comes at 0.8512, expected to provide support. Similarly, the daily 61.8% fib level is at 0.8527, expected to provide support.
The USD/CHF pair moves sideways in the presence of heightened geopolitical conflict in the Middle East, hovering around 0.8530 during the European session on Monday. The Iran-backed Houthi militia launched an anti-ship missile at the USS Laboon in the Red Sea on Monday, which was intercepted by a US fighter jet, resulting in no harm to the navy vessel or the aircraft. This situation follows the military attacks on Iran-led Houthi targets carried out by the United States (US) and the United Kingdom (UK) on Friday. These events are perceived to have bolstered the demand for the safe-haven currency Swiss Franc (CHF).
US Dollar Index (DXY) trims intraday losses, improving toward 102.50 at the time of writing. The Greenback faced challenges after the release of the downbeat Producer Price Index (PPI) data on Friday as it reinforces the market speculation of Federal Reserve’s rate cuts as early as March by 25 basis points. The US Producer Price Index (PPI) figure was reported at 1.0% year-on-year in December, surpassing the previous reading of 0.8%. However, the Core PPI year-on-year arrived at 1.8%, down from 2.0% in November. The monthly headline and Core PPI indices remained at a 0.1% decline and 0.0%, respectively.
On the Swiss side, the Swiss Franc (CHF) gained support and recorded profits last week, driven by positive economic data. The Consumer Price Index (YoY) for December showed continued growth, and there was an improvement in Real Retail Sales. These positive economic indicators contributed to the overall strength of the Swiss Franc.
Additionally, the upcoming five-day World Economic Forum in Davos is anticipated to have an impact. More than 28,000 leaders from around the world are expected to participate in the 54th World Economic Forum Annual Meeting, starting on Monday. The event could provide insights and discussions on various economic and geopolitical issues.
Technical Levels: Supports and Resistances
USDCHF currently trading at 0.8527 at the time of writing. Pair opened at 0.8522 and is trading with a change of 0.06 % .
| Overview | Overview.1 | |
|---|---|---|
| 0 | Today last price | 0.8527 |
| 1 | Today Daily Change | 0.0005 |
| 2 | Today Daily Change % | 0.0600 |
| 3 | Today daily open | 0.8522 |
The pair is trading above its 20 Daily moving average @ 0.8519, below its 50 Daily moving average @ 0.8707 , below its 100 Daily moving average @ 0.8854 and below its 200 Daily moving average @ 0.8872
| Trends | Trends.1 | |
|---|---|---|
| 0 | Daily SMA20 | 0.8519 |
| 1 | Daily SMA50 | 0.8707 |
| 2 | Daily SMA100 | 0.8854 |
| 3 | Daily SMA200 | 0.8872 |
The previous day high was 0.8551 while the previous day low was 0.8489. The daily 38.2% Fib levels comes at 0.8512, expected to provide support. Similarly, the daily 61.8% fib level is at 0.8527, expected to provide support.
Note the levels of interest below:
- Pivot support is noted at 0.849, 0.8458, 0.8428
- Pivot resistance is noted at 0.8552, 0.8583, 0.8615
| Levels | Levels.1 |
|---|---|
| Previous Daily High | 0.8551 |
| Previous Daily Low | 0.8489 |
| Previous Weekly High | 0.8566 |
| Previous Weekly Low | 0.8460 |
| Previous Monthly High | 0.8821 |
| Previous Monthly Low | 0.8333 |
| Daily Fibonacci 38.2% | 0.8512 |
| Daily Fibonacci 61.8% | 0.8527 |
| Daily Pivot Point S1 | 0.8490 |
| Daily Pivot Point S2 | 0.8458 |
| Daily Pivot Point S3 | 0.8428 |
| Daily Pivot Point R1 | 0.8552 |
| Daily Pivot Point R2 | 0.8583 |
| Daily Pivot Point R3 | 0.8615 |
[/s2If]
Nehcap Trading Strategies
The NEHCAP currently runs the following trading systems for clients. They can be bought and run on your funds.
The system is trading live: LIVE ACCOUNT TRACKING
Contact Us: Contact
The HFT_FIX can be run free for 2 weeks on any broker with a ECN. Apply for a free trial
Join Our Telegram Group
")


