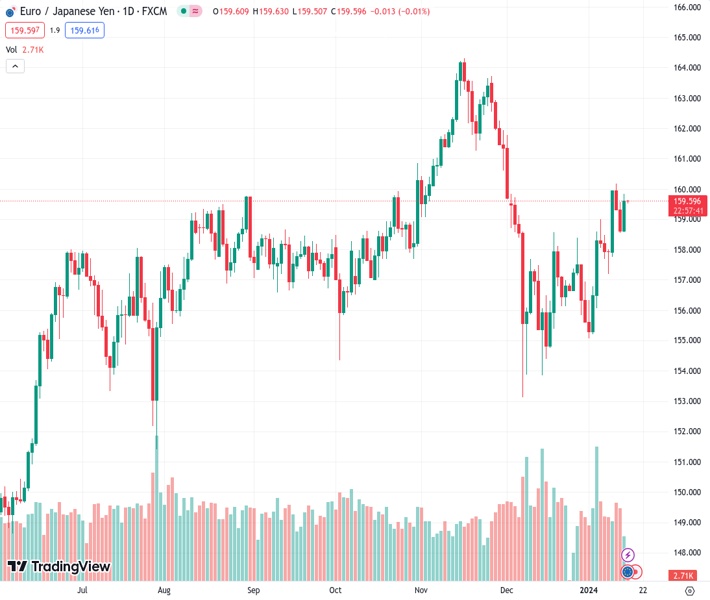
#EURJPY @ 159.623 ‘s rise above Ichimoku Cloud indicates a bullish shift, with a focus on overcoming the 160.00 barrier. (Pivot Orderbook analysis)
…
This is a premium post.
[s2If !current_user_can(access_s2member_level4)]Please register for FREE REGISTER to read full post below containing analysis. In case of any error or you think you are not able to read the full post below, please email us at support#nehcap.com [lwa][/s2If] [s2If current_user_can(access_s2member_level1)]
- EUR/JPY’s rise above Ichimoku Cloud indicates a bullish shift, with a focus on overcoming the 160.00 barrier.
- Next resistance targets include January 11 high at 160.18 and November 21 low at 161.25.
- Downside risk persists if EUR/JPY fails to breach 160.00, opens the door to challenge key support levels at 158.71, 158.12 and 157.57.
The pair currently trades last at 159.623.
The previous day high was 159.8 while the previous day low was 158.54. The daily 38.2% Fib levels comes at 159.02, expected to provide support. Similarly, the daily 61.8% fib level is at 159.32, expected to provide support.
The EUR/JPY rose above the Ichimoku Cloud (Kumo), turned bullish on Monday, and gained some 0.63% after hitting a daily low of 158.58. As the Asian session begins, the pair trades at 159.58 is virtually unchanged, loses 0.02%.
The daily chart depicts the cross-pair is bullish and would face stir resistance at around the 160.00 figure. A breach of the latter would expose the January 11 high of 160.18, followed by the November 21 daily low turned resistance at around 161.25.
On the other hand, if sellers stepped in and kept the EUR/JPY exchange rate below 160.00, that could pave the way for further losses. The first support would be the Senkou Span B at 158.71, followed by the Tenkan-Sen at 158.12. Further downside is seen at the Senkou Span A at 157.57.
Technical Levels: Supports and Resistances
EURJPY currently trading at 159.6 at the time of writing. Pair opened at 158.68 and is trading with a change of 0.58 % .
| Overview | Overview.1 | |
|---|---|---|
| 0 | Today last price | 159.60 |
| 1 | Today Daily Change | 0.92 |
| 2 | Today Daily Change % | 0.58 |
| 3 | Today daily open | 158.68 |
The pair remains strongly bullish on the daily timeframe. It trades above its 20 SMA @ 157.32, 50 SMA 159.21, 100 SMA @ 158.65 and 200 SMA @ 155.75.
| Trends | Trends.1 | |
|---|---|---|
| 0 | Daily SMA20 | 157.32 |
| 1 | Daily SMA50 | 159.21 |
| 2 | Daily SMA100 | 158.65 |
| 3 | Daily SMA200 | 155.75 |
The previous day high was 159.8 while the previous day low was 158.54. The daily 38.2% Fib levels comes at 159.02, expected to provide support. Similarly, the daily 61.8% fib level is at 159.32, expected to provide support.
Note the levels of interest below:
- Pivot support is noted at 158.22, 157.75, 156.96
- Pivot resistance is noted at 159.47, 160.26, 160.73
| Levels | Levels.1 |
|---|---|
| Previous Daily High | 159.80 |
| Previous Daily Low | 158.54 |
| Previous Weekly High | 160.18 |
| Previous Weekly Low | 157.21 |
| Previous Monthly High | 161.78 |
| Previous Monthly Low | 153.17 |
| Daily Fibonacci 38.2% | 159.02 |
| Daily Fibonacci 61.8% | 159.32 |
| Daily Pivot Point S1 | 158.22 |
| Daily Pivot Point S2 | 157.75 |
| Daily Pivot Point S3 | 156.96 |
| Daily Pivot Point R1 | 159.47 |
| Daily Pivot Point R2 | 160.26 |
| Daily Pivot Point R3 | 160.73 |
[/s2If]
Nehcap Trading Strategies
The NEHCAP currently runs the following trading systems for clients. They can be bought and run on your funds.
The system is trading live: LIVE ACCOUNT TRACKING
Contact Us: Contact
The HFT_FIX can be run free for 2 weeks on any broker with a ECN. Apply for a free trial
Join Our Telegram Group
")


