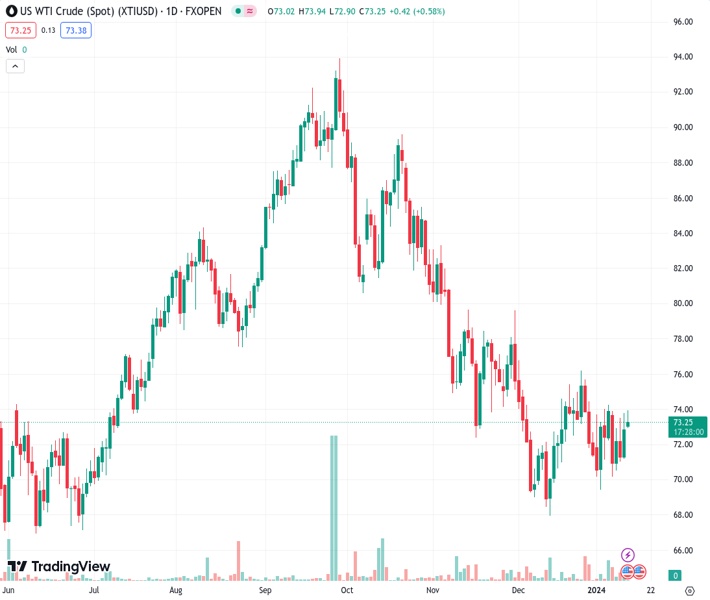
WTI price moves upward over the escalation of the Israel-Gaza conflict. (Pivot Orderbook analysis)
…
This is a premium post.
[s2If !current_user_can(access_s2member_level4)]Please register for FREE REGISTER to read full post below containing analysis. In case of any error or you think you are not able to read the full post below, please email us at support#nehcap.com [lwa][/s2If] [s2If current_user_can(access_s2member_level1)]
- WTI price moves upward over the escalation of the Israel-Gaza conflict.
- US and UK military forces have carried out air strikes against various Houthi locations in Yemen.
- Iran has captured a civilian oil tanker “Marshall Islands-flagged St Nikolas” carrying Iraqi Crude destined for Turkey.
- The improved Chinese Trade Balance data could support reinforcing the Crude oil prices.
The pair currently trades last at 73.47.
The previous day high was 73.8 while the previous day low was 71.23. The daily 38.2% Fib levels comes at 72.82, expected to provide support. Similarly, the daily 61.8% fib level is at 72.21, expected to provide support.
West Texas Intermediate (WTI) price rises on the second consecutive day, driven by heightened concerns over potential oil supply disruptions in the Red Sea. Air strikes carried out by the United States (US) and United Kingdom (UK) targeted Iran-backed Houthis in Yemen, raising fears that the situation could escalate the Israel-Gaza conflict into a regional conflict. The WTI price improves near $73.50 per barrel during the Asian session on Friday.
President Joe Biden announced that, in collaboration with the United Kingdom and with the assistance of Australia, Bahrain, Canada, and the Netherlands, US military forces have carried out successful strikes against various Houthi locations in Yemen. Additionally, Biden emphasized that he is ready to take further actions without hesitation following the airstrikes on Houthi targets in Yemen.
Crude oil prices gained upward momentum following Iran’s announcement of the capture of a civilian oil tanker “Marshall Islands-flagged St Nikolas” carrying Iraqi Crude destined for Turkey in the Gulf of Oman on Thursday. Official Iranian state media declared the seizure as a retaliatory measure against the United States’ seizure of the same ship a year ago, which was headed for Iran at that time. The incident is anticipated to contribute to continued volatility in crude oil prices in the coming days.
Additionally, the recently released better-than-expected Chinese trade data for December could potentially bolster support for Crude oil products, given China’s status as the largest oil importer. The Chinese Trade Balance in USD for December rose to $75.34B from the previous $68.39B, surpassing the expected $74.75B. The Exports (YoY) figure exhibited a growth of 2.3%, surpassing the expected 1.7%. Meanwhile, the yearly Imports in CNY increased by 1.6%, compared to the previous 0.6%. These positive trade figures from China may contribute to a favorable environment for Crude oil prices.
Technical Levels: Supports and Resistances
XTIUSD currently trading at 73.47 at the time of writing. Pair opened at 72.47 and is trading with a change of 1.38 % .
| Overview | Overview.1 | |
|---|---|---|
| 0 | Today last price | 73.47 |
| 1 | Today Daily Change | 1.00 |
| 2 | Today Daily Change % | 1.38 |
| 3 | Today daily open | 72.47 |
The pair is trading above its 20 Daily moving average @ 72.79, below its 50 Daily moving average @ 74.15 , below its 100 Daily moving average @ 80.07 and below its 200 Daily moving average @ 77.6
| Trends | Trends.1 | |
|---|---|---|
| 0 | Daily SMA20 | 72.79 |
| 1 | Daily SMA50 | 74.15 |
| 2 | Daily SMA100 | 80.07 |
| 3 | Daily SMA200 | 77.60 |
The previous day high was 73.8 while the previous day low was 71.23. The daily 38.2% Fib levels comes at 72.82, expected to provide support. Similarly, the daily 61.8% fib level is at 72.21, expected to provide support.
Note the levels of interest below:
- Pivot support is noted at 71.2, 69.93, 68.64
- Pivot resistance is noted at 73.77, 75.06, 76.33
| Levels | Levels.1 |
|---|---|
| Previous Daily High | 73.80 |
| Previous Daily Low | 71.23 |
| Previous Weekly High | 74.28 |
| Previous Weekly Low | 69.41 |
| Previous Monthly High | 76.79 |
| Previous Monthly Low | 67.97 |
| Daily Fibonacci 38.2% | 72.82 |
| Daily Fibonacci 61.8% | 72.21 |
| Daily Pivot Point S1 | 71.20 |
| Daily Pivot Point S2 | 69.93 |
| Daily Pivot Point S3 | 68.64 |
| Daily Pivot Point R1 | 73.77 |
| Daily Pivot Point R2 | 75.06 |
| Daily Pivot Point R3 | 76.33 |
[/s2If]
Nehcap Trading Strategies
The NEHCAP currently runs the following trading systems for clients. They can be bought and run on your funds.
The system is trading live: LIVE ACCOUNT TRACKING
Contact Us: Contact
The HFT_FIX can be run free for 2 weeks on any broker with a ECN. Apply for a free trial
Join Our Telegram Group
")


