#USDCAD @ 1.34396 retraces its recent gains as Crude prices continue to gain ground. (Pivot Orderbook analysis)
…
This is a premium post.
[s2If !current_user_can(access_s2member_level4)]Please register for FREE REGISTER to read full post below containing analysis. In case of any error or you think you are not able to read the full post below, please email us at support#nehcap.com [lwa][/s2If] [s2If current_user_can(access_s2member_level1)]
- USD/CAD retraces its recent gains as Crude prices continue to gain ground.
- WTI price moves upward over escalated concern of Middle-East conflict.
- US and UK military forces conducted air strikes on Iran-led Houthi targets in Yemen.
- The risk-on mood weakens the US Dollar despite upbeat US CPI data and improved US yields.
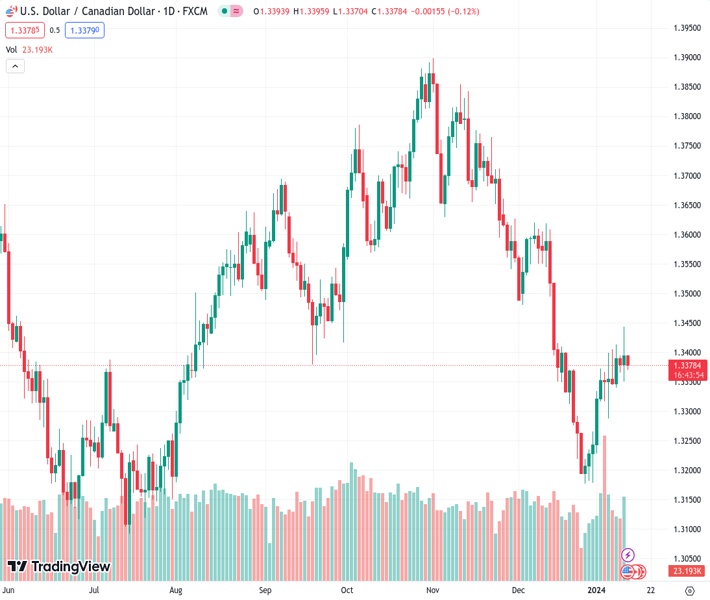
The pair currently trades last at 1.34396.
The previous day high was 1.3443 while the previous day low was 1.3351. The daily 38.2% Fib levels comes at 1.3408, expected to provide support. Similarly, the daily 61.8% fib level is at 1.3386, expected to provide support.
USD/CAD retraces its recent gains registered in the previous session, edging lower to near 1.3380 during the Asian session on Friday. The Canadian Dollar (CAD) has strengthened in response to the increase in crude oil prices, which can be linked to the heightened tensions in the Middle East.
The military forces of the United States (US) and United Kingdom (UK), supported by Australia, Bahrain, Canada, and the Netherlands, conducted air strikes on Houthi targets in Yemen led by Iran. This action was taken in an effort to safeguard maritime vessels in the Red Sea. West Texas Intermediate (WTI) price trades near $73.40 per barrel at the time of writing.
In the absence of Economic data from Canada for the entire week, traders waiting for next week’s Canada Consumer Price Index data for December and Retail Sales figures for November on Tuesday and Friday, respectively.
The US Dollar (USD) faces challenges on improved risk appetite as traders move away from the Greenback, which could be attributed to the speculation of Federal Reserve’s (Fed) rate cuts in March and May. The US Dollar Index (DXY) trades slightly lower around 102.20 despite improved US Treasury yields.
On Thursday, the positive US inflation data provided support for the US Dollar, enabling it to gain some upward traction. The US Consumer Price Index (CPI) recorded a 3.4% year-on-year increase in December, surpassing both November’s 3.1% and the expected market figure of 3.2%. Additionally, the monthly CPI growth for December exhibited a 0.3% increase, surpassing the market projection of 0.2%. However, the annual Core CPI slightly eased to 3.9% from the previous reading of 4.0%, while the monthly figure remained stable at 0.3%, aligning with expectations.
Traders await the release of the US Producer Price Index (PPI) data for December, along with the speech by Federal Reserve member Neel Kashkari later in the North American session, seeking additional insights into the economic landscape of the United States.
Technical Levels: Supports and Resistances
USDCAD currently trading at 1.3382 at the time of writing. Pair opened at 1.3398 and is trading with a change of -0.12 % .
| Overview | Overview.1 | |
|---|---|---|
| 0 | Today last price | 1.3382 |
| 1 | Today Daily Change | -0.0016 |
| 2 | Today Daily Change % | -0.1200 |
| 3 | Today daily open | 1.3398 |
The pair is trading above its 20 Daily moving average @ 1.3318, below its 50 Daily moving average @ 1.3516 , below its 100 Daily moving average @ 1.3572 and below its 200 Daily moving average @ 1.348
| Trends | Trends.1 | |
|---|---|---|
| 0 | Daily SMA20 | 1.3318 |
| 1 | Daily SMA50 | 1.3516 |
| 2 | Daily SMA100 | 1.3572 |
| 3 | Daily SMA200 | 1.3480 |
The previous day high was 1.3443 while the previous day low was 1.3351. The daily 38.2% Fib levels comes at 1.3408, expected to provide support. Similarly, the daily 61.8% fib level is at 1.3386, expected to provide support.
Note the levels of interest below:
- Pivot support is noted at 1.3352, 1.3305, 1.3259
- Pivot resistance is noted at 1.3444, 1.349, 1.3536
| Levels | Levels.1 |
|---|---|
| Previous Daily High | 1.3443 |
| Previous Daily Low | 1.3351 |
| Previous Weekly High | 1.3399 |
| Previous Weekly Low | 1.3229 |
| Previous Monthly High | 1.3620 |
| Previous Monthly Low | 1.3178 |
| Daily Fibonacci 38.2% | 1.3408 |
| Daily Fibonacci 61.8% | 1.3386 |
| Daily Pivot Point S1 | 1.3352 |
| Daily Pivot Point S2 | 1.3305 |
| Daily Pivot Point S3 | 1.3259 |
| Daily Pivot Point R1 | 1.3444 |
| Daily Pivot Point R2 | 1.3490 |
| Daily Pivot Point R3 | 1.3536 |
[/s2If]
Nehcap Trading Strategies
The NEHCAP currently runs the following trading systems for clients. They can be bought and run on your funds.
The system is trading live: LIVE ACCOUNT TRACKING
Contact Us: Contact
The HFT_FIX can be run free for 2 weeks on any broker with a ECN. Apply for a free trial
Join Our Telegram Group
")


