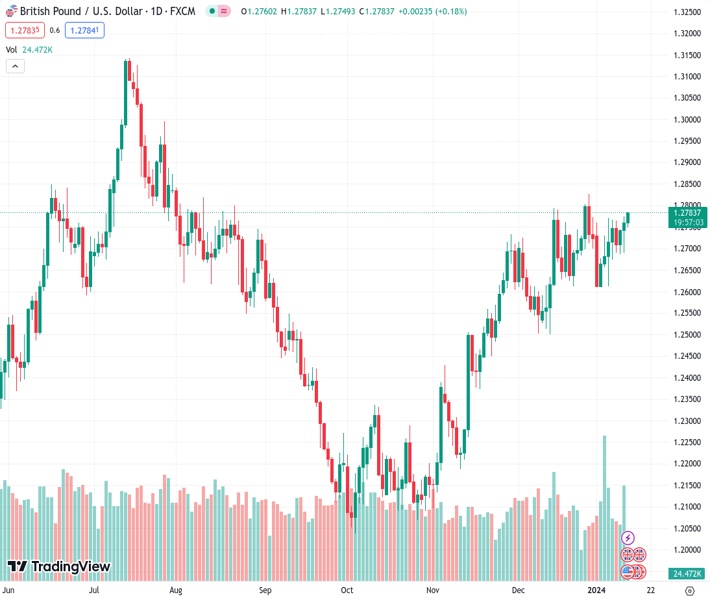
#GBPUSD @ 1.27794 trades strongly for the third consecutive day on Friday. (Pivot Orderbook analysis)
…
This is a premium post.
[s2If !current_user_can(access_s2member_level4)]Please register for FREE REGISTER to read full post below containing analysis. In case of any error or you think you are not able to read the full post below, please email us at support#nehcap.com [lwa][/s2If] [s2If current_user_can(access_s2member_level1)]
- GBP/USD trades strongly for the third consecutive day on Friday.
- The BOE may be forced to provide the timeline of its first rate cut as inflation might decline faster than expected.
- The US CPI inflation reports may challenge the plans of the Federal Reserve (Fed) to cut the interest rate this year.
- Traders will monitor the monthly GDP growth numbers for November and the US Producer Price Index (PPI).
The pair currently trades last at 1.27794.
The previous day high was 1.2774 while the previous day low was 1.269. The daily 38.2% Fib levels comes at 1.2742, expected to provide support. Similarly, the daily 61.8% fib level is at 1.2723, expected to provide support.
The GBP/USD pair gains ground to nearly the weekly high during the early Asian trading hours on Friday. The November UK Gross Domestic Product (GDP) is estimated to grow by 0.2% MoM from the 0.3% contraction in the previous reading. GBP/USD currently trades near 1.2780, gaining 0.16% on the day.
The Bank of England (BOE) Governor Andrew Bailey had forecast a tough battle lay ahead to bring inflation back to its 2% target while pushing back against speculation about cutting rates. Nonetheless, a decline in energy prices might bring inflation down at a faster rate than the BOE expected. The UK central bank may be forced to provide the timeline of its first interest rate cut after three leading forecasters issued a surprise update suggesting the inflation rate will halve to 2% by April.
On the USD’s front, the recent US inflation reports may challenge the plans of the Federal Reserve (Fed) to cut the interest rate this year. The US Bureau of Labor Statistics showed on Thursday that the US Consumer Price Index (CPI) increased more than estimated in December, as the CPI rose 3.4% YoY from the 3.1% increase seen the month prior. The Core CPI figure, which excludes volatile food and energy prices, grew 3.9% YoY in December, above the market consensus of 3.8%.
Looking ahead, market participants will keep an eye on the UK Manufacturing Production, Industrial Production, and monthly Gross Domestic Product for November. On the US docket, the Producer Price Index (PPI) for December will be due, and Fed’s Neel Kashkari is set to speak.
Technical Levels: Supports and Resistances
GBPUSD currently trading at 1.2774 at the time of writing. Pair opened at 1.276 and is trading with a change of 0.11 % .
| Overview | Overview.1 | |
|---|---|---|
| 0 | Today last price | 1.2774 |
| 1 | Today Daily Change | 0.0014 |
| 2 | Today Daily Change % | 0.1100 |
| 3 | Today daily open | 1.2760 |
The pair remains strongly bullish on the daily timeframe. It trades above its 20 SMA @ 1.2707, 50 SMA 1.2588, 100 SMA @ 1.2449 and 200 SMA @ 1.2544.
| Trends | Trends.1 | |
|---|---|---|
| 0 | Daily SMA20 | 1.2707 |
| 1 | Daily SMA50 | 1.2588 |
| 2 | Daily SMA100 | 1.2449 |
| 3 | Daily SMA200 | 1.2544 |
The previous day high was 1.2774 while the previous day low was 1.269. The daily 38.2% Fib levels comes at 1.2742, expected to provide support. Similarly, the daily 61.8% fib level is at 1.2723, expected to provide support.
Note the levels of interest below:
- Pivot support is noted at 1.2708, 1.2658, 1.2624
- Pivot resistance is noted at 1.2792, 1.2825, 1.2876
| Levels | Levels.1 |
|---|---|
| Previous Daily High | 1.2774 |
| Previous Daily Low | 1.2690 |
| Previous Weekly High | 1.2771 |
| Previous Weekly Low | 1.2611 |
| Previous Monthly High | 1.2828 |
| Previous Monthly Low | 1.2501 |
| Daily Fibonacci 38.2% | 1.2742 |
| Daily Fibonacci 61.8% | 1.2723 |
| Daily Pivot Point S1 | 1.2708 |
| Daily Pivot Point S2 | 1.2658 |
| Daily Pivot Point S3 | 1.2624 |
| Daily Pivot Point R1 | 1.2792 |
| Daily Pivot Point R2 | 1.2825 |
| Daily Pivot Point R3 | 1.2876 |
[/s2If]
Nehcap Trading Strategies
The NEHCAP currently runs the following trading systems for clients. They can be bought and run on your funds.
The system is trading live: LIVE ACCOUNT TRACKING
Contact Us: Contact
The HFT_FIX can be run free for 2 weeks on any broker with a ECN. Apply for a free trial
Join Our Telegram Group
")


