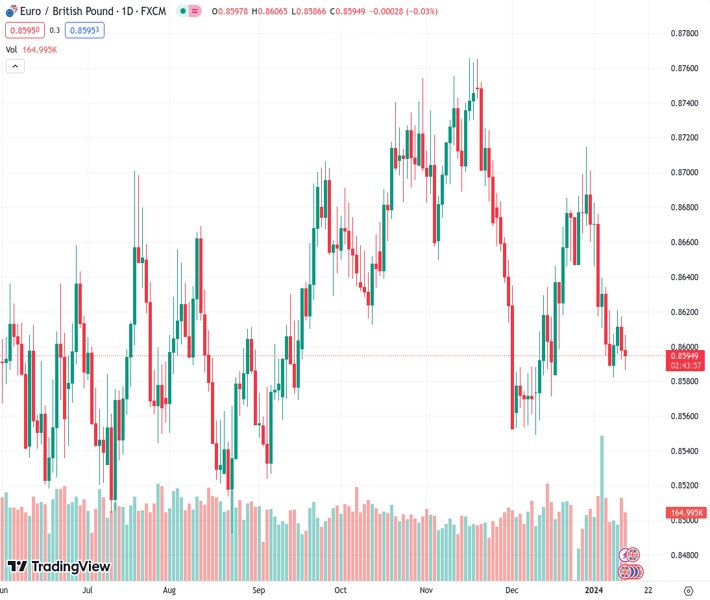
#EURGBP @ 0.85951 trades neutral at 0.8597, set to close a third straight weekly loss. (Pivot Orderbook analysis)
…
This is a premium post.
[s2If !current_user_can(access_s2member_level4)]Please register for FREE REGISTER to read full post below containing analysis. In case of any error or you think you are not able to read the full post below, please email us at support#nehcap.com [lwa][/s2If] [s2If current_user_can(access_s2member_level1)]
- EUR/GBP trades neutral at 0.8597, set to close a third straight weekly loss.
- Key technical indicators suggest a bearish momentum, despite slight gains, with RSI and MACD on the daily chart in negative.
- Mixed readings are seen on the four-hour indicators.
The pair currently trades last at 0.85951.
The previous day high was 0.8617 while the previous day low was 0.8596. The daily 38.2% Fib levels comes at 0.8604, expected to provide resistance. Similarly, the daily 61.8% fib level is at 0.8609, expected to provide resistance.
In Friday’s session, the EUR/GBP pair was observed trading flat at around 0.8600. From a broader perspective, the daily chart showcases a neutral to bearish sentiment, with bears firmly defending their territory. Additionally, in the four-hour timeframe, the indicators present a mixed landscape.
Looking at the daily chart indicators, the prevailing force is evidently the selling momentum. The Relative Strength Index (RSI) is leveling off in the negative territory, which is usually a signal for a possible continuation of a downward trend. Moreover, with the Moving Average Convergence Divergence (MACD) showing flat red bars, there is a clear indication of sustained bearish action.
Furthermore, the pair is located under its 20, 100, and 200-day Simple Moving Averages (SMAs), which signifies the controlled supremacy of sellers over an extensive time frame. Given this current state, any reversal to the upside will need a significant effort from buyers.
Moving on to the shorter time frame and focusing on the four-hour chart, a similar pattern in indicators to the daily chart, with both the Relative Strength Index (RSI) and Moving Average Convergence Divergence (MACD) presenting a rather flat and inactive landscape in the negative sector. This state of affairs suggests that the bears are still holding their positions and maintaining tight control over the buyers.
Technical Levels: Supports and Resistances
EURGBP currently trading at 0.8596 at the time of writing. Pair opened at 0.8599 and is trading with a change of -0.03 % .
| Overview | Overview.1 | |
|---|---|---|
| 0 | Today last price | 0.8596 |
| 1 | Today Daily Change | -0.0003 |
| 2 | Today Daily Change % | -0.0300 |
| 3 | Today daily open | 0.8599 |
The pair remains strongly bearish on the daily time frame. It trades below the 20 SMA @ 0.8642, 50 SMA 0.8654, 100 SMA @ 0.8649 and 200 SMA @ 0.8649.
| Trends | Trends.1 | |
|---|---|---|
| 0 | Daily SMA20 | 0.8642 |
| 1 | Daily SMA50 | 0.8654 |
| 2 | Daily SMA100 | 0.8649 |
| 3 | Daily SMA200 | 0.8649 |
The previous day high was 0.8617 while the previous day low was 0.8596. The daily 38.2% Fib levels comes at 0.8604, expected to provide resistance. Similarly, the daily 61.8% fib level is at 0.8609, expected to provide resistance.
Note the levels of interest below:
- Pivot support is noted at 0.859, 0.8582, 0.8569
- Pivot resistance is noted at 0.8612, 0.8626, 0.8634
| Levels | Levels.1 |
|---|---|
| Previous Daily High | 0.8617 |
| Previous Daily Low | 0.8596 |
| Previous Weekly High | 0.8683 |
| Previous Weekly Low | 0.8600 |
| Previous Monthly High | 0.8715 |
| Previous Monthly Low | 0.8549 |
| Daily Fibonacci 38.2% | 0.8604 |
| Daily Fibonacci 61.8% | 0.8609 |
| Daily Pivot Point S1 | 0.8590 |
| Daily Pivot Point S2 | 0.8582 |
| Daily Pivot Point S3 | 0.8569 |
| Daily Pivot Point R1 | 0.8612 |
| Daily Pivot Point R2 | 0.8626 |
| Daily Pivot Point R3 | 0.8634 |
[/s2If]
Nehcap Trading Strategies
The NEHCAP currently runs the following trading systems for clients. They can be bought and run on your funds.
The system is trading live: LIVE ACCOUNT TRACKING
Contact Us: Contact
The HFT_FIX can be run free for 2 weeks on any broker with a ECN. Apply for a free trial
Join Our Telegram Group
")


