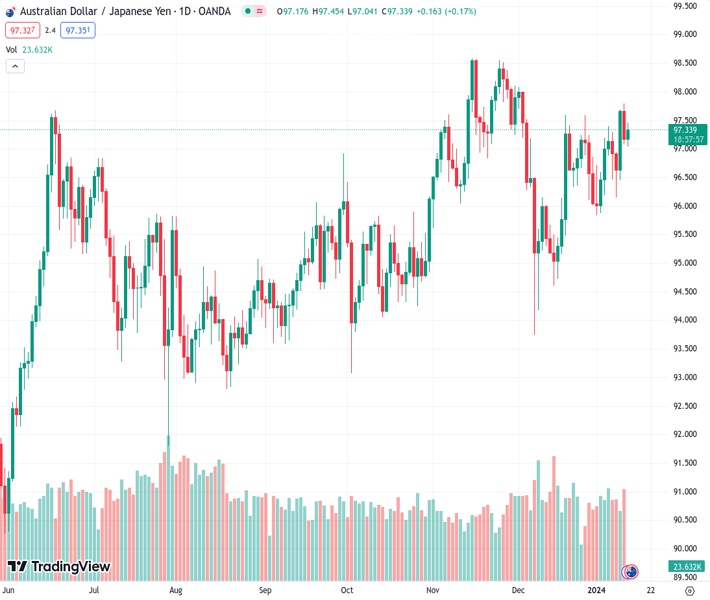
#AUDJPY @ 97.3220 catches fresh bids on Friday and reverses a part of the overnight retracement slide. (Pivot Orderbook analysis)
…
This is a premium post.
[s2If !current_user_can(access_s2member_level4)]Please register for FREE REGISTER to read full post below containing analysis. In case of any error or you think you are not able to read the full post below, please email us at support#nehcap.com [lwa][/s2If] [s2If current_user_can(access_s2member_level1)]
- AUD/JPY catches fresh bids on Friday and reverses a part of the overnight retracement slide.
- Hopes for additional stimulus from China boosts the Aussie and lends support to the cross.
- Dovish BoJ expectations undermine the JPY, though geopolitical risks cap gains for spot prices.
The pair currently trades last at 97.3220.
The previous day high was 97.8 while the previous day low was 97.08. The daily 38.2% Fib levels comes at 97.36, expected to provide resistance. Similarly, the daily 61.8% fib level is at 97.53, expected to provide resistance.
The AUD/JPY cross attracts some dip-buying near the 100-hour Simple Moving Average (SMA), around the 97.00 mark, and climbs to a fresh daily peak following the release of Chinese inflation figures. Spot prices currently trade just below mid-97.00s, up nearly 0.20% for the day, reversing a part of the previous day’s retracement slide from the highest level since December 4.
The National Bureau of Statistics reported that the Consumer Price Index (CPI) in China declined for the third consecutive month, by the 0.3% YoY rate in December. Adding to this, The Producer Price Index (PPI), which measures costs for goods at the factory gate, fell 2.7% YoY in December, marking the 15th straight month of drop. The data fuelled speculations that the government may announce additional stimulus to address deflationary risks.
Furthermore, China’s Customs reported that the country’s 2023 exports and imports of goods were better than expected, boosting the China-proxy Aussie and assisting the AUD/JPY cross to gain positive traction. In fact, China’s 2023 Yuan-denominated exports rose by 0.6% YoY, signalling that global trade is starting to recover. However, imports were down 0.3% YoY, suggesting sluggish domestic demand and adding to worries about slow economic recovery.
Apart from this, geopolitical risks stemming from the Israel-Hamas war benefit the Japanese Yen’s (JPY) relative safe-haven status and contribute to capping the AUD/JPY cross. Any meaningful downside, however, still seems elusive in the wake of expectations that the Bank of Japan (BoJ) is unlikely to pivot away from its ultra-dovish policy stance anytime soon in the wake of the government stimulus measures following a devastating earthquake in Japan.
The aforementioned mixed fundamental backdrop warrants some caution before placing aggressive directional bets around the AUD/JPY cross. Even from a technical perspective, spot prices have been oscillating in a familiar band over the past three weeks or so. This further makes it prudent to wait for a sustained breakout through the trading range before positioning for a firm near-term trajectory for spot prices.
Technical Levels: Supports and Resistances
AUDJPY currently trading at 97.36 at the time of writing. Pair opened at 97.24 and is trading with a change of 0.12 % .
| Overview | Overview.1 | |
|---|---|---|
| 0 | Today last price | 97.36 |
| 1 | Today Daily Change | 0.12 |
| 2 | Today Daily Change % | 0.12 |
| 3 | Today daily open | 97.24 |
The pair remains strongly bullish on the daily timeframe. It trades above its 20 SMA @ 96.67, 50 SMA 96.87, 100 SMA @ 95.91 and 200 SMA @ 94.46.
| Trends | Trends.1 | |
|---|---|---|
| 0 | Daily SMA20 | 96.67 |
| 1 | Daily SMA50 | 96.87 |
| 2 | Daily SMA100 | 95.91 |
| 3 | Daily SMA200 | 94.46 |
The previous day high was 97.8 while the previous day low was 97.08. The daily 38.2% Fib levels comes at 97.36, expected to provide resistance. Similarly, the daily 61.8% fib level is at 97.53, expected to provide resistance.
Note the levels of interest below:
- Pivot support is noted at 96.95, 96.65, 96.23
- Pivot resistance is noted at 97.67, 98.09, 98.39
| Levels | Levels.1 |
|---|---|
| Previous Daily High | 97.80 |
| Previous Daily Low | 97.08 |
| Previous Weekly High | 97.40 |
| Previous Weekly Low | 95.84 |
| Previous Monthly High | 98.07 |
| Previous Monthly Low | 93.73 |
| Daily Fibonacci 38.2% | 97.36 |
| Daily Fibonacci 61.8% | 97.53 |
| Daily Pivot Point S1 | 96.95 |
| Daily Pivot Point S2 | 96.65 |
| Daily Pivot Point S3 | 96.23 |
| Daily Pivot Point R1 | 97.67 |
| Daily Pivot Point R2 | 98.09 |
| Daily Pivot Point R3 | 98.39 |
[/s2If]
Nehcap Trading Strategies
The NEHCAP currently runs the following trading systems for clients. They can be bought and run on your funds.
The system is trading live: LIVE ACCOUNT TRACKING
Contact Us: Contact
The HFT_FIX can be run free for 2 weeks on any broker with a ECN. Apply for a free trial
Join Our Telegram Group
")


