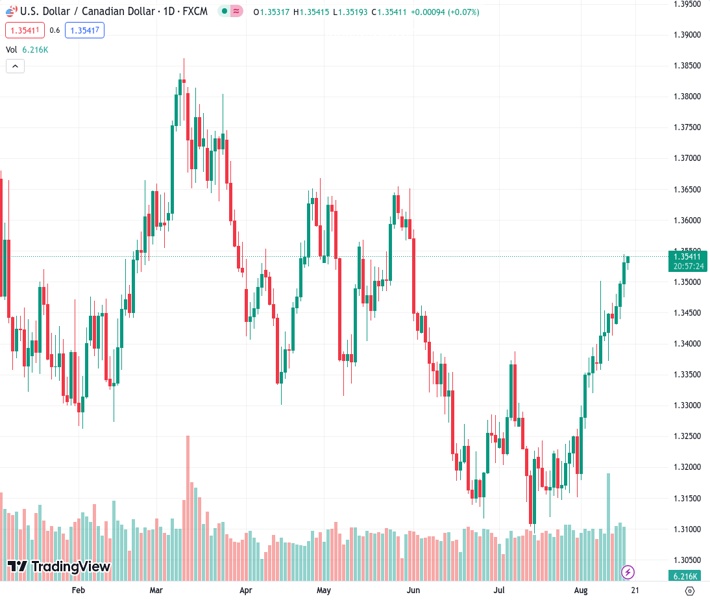
The USDCAD exchange rate of 1.35375 has reached its highest point in 11 weeks, but is currently showing less upward momentum as buyers pause after a three-day upward trend. According to the viewpoint of @nehcap, a slight decline is anticipated in the near future.
…
This is a premium post.
[s2If !current_user_can(access_s2member_level4)]Please register for FREE REGISTER to read full post below containing analysis. In case of any error or you think you are not able to read the full post below, please email us at support#nehcap.com [lwa][/s2If] [s2If current_user_can(access_s2member_level1)]
- USD/CAD grinds at the highest level in 11 weeks as bulls take a breather after three-day uptrend.
The pair currently trades last at 1.35375.
The previous day high was 1.3502 while the previous day low was 1.3439. The daily 38.2% Fib levels comes at 1.3478, expected to provide support. Similarly, the daily 61.8% fib level is at 1.3463, expected to provide support.
USD/CAD seesaws around the highest level since early June, marked the previous day, as bulls jostle with the key upside hurdle amid overbought RSI conditions. Even so, the Loonie pair defends the early-week breakout of the 200-DMA while flirting with the 1.3530-35 amid Thursday’s Asian session, after a three-day uptrend.
That said, an upward-sloping resistance line from July 07 restricts the immediate USD/CAD upside near 1.3540 as the overbought RSI and the lack of major data/events check the Loonie pair buyers.
However, a sustained upside break of the 200-DMA and the bullion MACD signals keep the buyers hopeful unless the quote drops below 1.3450 DMA support.
Even if the quote breaks the stated 1.3450 support, the early July swing high of around 1.3385 and late 2022 bottom surrounding 1.3325 may prod the USD/CAD bears.
It’s worth mentioning that a nine-month-old falling support line, close to 1.3085 at the latest, will challenge the quote’s weakness past 1.3325.
On the flip side, a daily closing beyond the immediate 1.3450 hurdle could quickly direct the USD/CAD buyers toward a horizontal area comprising multiple levels marked since late February around 1.3655–65.
Following that, a descending resistance line from October 2022, around 1.3690 by the press time, will challenge the Loonie pair buyers.
Trend: Pullback expected
Technical Levels: Supports and Resistances
USDCAD currently trading at 1.3534 at the time of writing. Pair opened at 1.3498 and is trading with a change of 0.27% % .
| Overview | Overview.1 | |
|---|---|---|
| 0 | Today last price | 1.3534 |
| 1 | Today Daily Change | 0.0036 |
| 2 | Today Daily Change % | 0.27% |
| 3 | Today daily open | 1.3498 |
The pair remains strongly bullish on the daily timeframe. It trades above its 20 SMA @ 1.331, 50 SMA 1.3271, 100 SMA @ 1.3384 and 200 SMA @ 1.3451.
| Trends | Trends.1 | |
|---|---|---|
| 0 | Daily SMA20 | 1.3310 |
| 1 | Daily SMA50 | 1.3271 |
| 2 | Daily SMA100 | 1.3384 |
| 3 | Daily SMA200 | 1.3451 |
The previous day high was 1.3502 while the previous day low was 1.3439. The daily 38.2% Fib levels comes at 1.3478, expected to provide support. Similarly, the daily 61.8% fib level is at 1.3463, expected to provide support.
Note the levels of interest below:
- Pivot support is noted at 1.3457, 1.3417, 1.3395
- Pivot resistance is noted at 1.352, 1.3542, 1.3582
| Levels | Levels.1 |
|---|---|
| Previous Daily High | 1.3502 |
| Previous Daily Low | 1.3439 |
| Previous Weekly High | 1.3502 |
| Previous Weekly Low | 1.3356 |
| Previous Monthly High | 1.3387 |
| Previous Monthly Low | 1.3093 |
| Daily Fibonacci 38.2% | 1.3478 |
| Daily Fibonacci 61.8% | 1.3463 |
| Daily Pivot Point S1 | 1.3457 |
| Daily Pivot Point S2 | 1.3417 |
| Daily Pivot Point S3 | 1.3395 |
| Daily Pivot Point R1 | 1.3520 |
| Daily Pivot Point R2 | 1.3542 |
| Daily Pivot Point R3 | 1.3582 |
[/s2If]
Download Nehcap EAWe have two EAs that are operational on our LIVE accounts.
- EA-FIX: Check out the details here. Download EA-FIX . EA-FIX is a non-grid HFT scalper.
- EA-GROWTH: High quality low dd EA using trend grids. Download EA_GROWTHJoin Our Telegram Group
")


