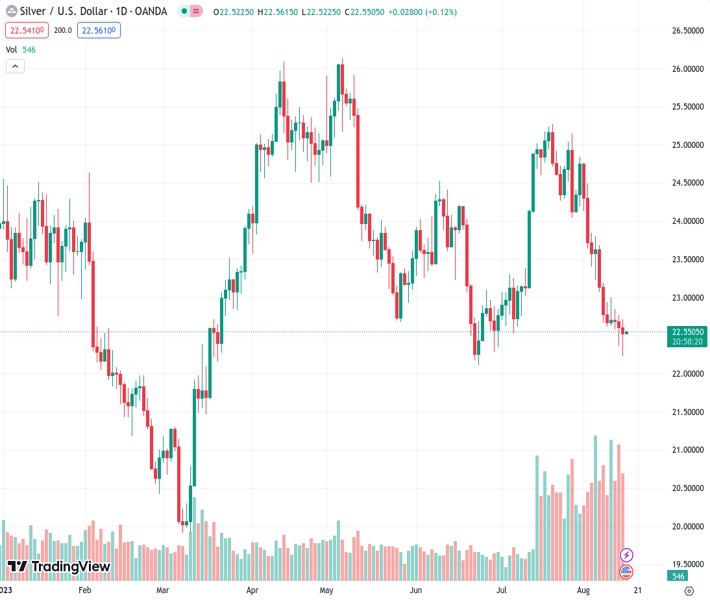
The XAGUSD, currently at 22.548, is experiencing a decline in silver price as it approaches a horizontal support level that has been in place for seven weeks. This decrease in price is happening in a cautious market environment. However, the outlook from @nehcap is that the decline is likely to be limited, suggesting that the downside potential is not expected to be significant.
…
This is a premium post.
[s2If !current_user_can(access_s2member_level4)]Please register for FREE REGISTER to read full post below containing analysis. In case of any error or you think you are not able to read the full post below, please email us at support#nehcap.com [lwa][/s2If] [s2If current_user_can(access_s2member_level1)]
- Silver Price retreats towards seven-week-old horizontal support amid cautious mood.
The pair currently trades last at 22.548.
The previous day high was 22.76 while the previous day low was 22.37. The daily 38.2% Fib levels comes at 22.52, expected to provide support. Similarly, the daily 61.8% fib level is at 22.61, expected to provide resistance.
Silver Price (XAG/USD) remains pressured at the lowest level in seven weeks despite making rounds to $22.50 during the early Asian session on Wednesday. In doing so, the bright metal fades the previous day’s corrective bounce off the key support zone amid the market’s broad risk-off mood and the firmer US Dollar and the Federal Reserve (Fed) monetary policy meeting minutes.
It’s worth noting that China-inflicted market pessimism joins the firmer US data to underpin the US Dollar’s run-up and weigh on the XAG/USD ahead of this week’s top-tier catalyst.
Technically, the 100-SMA stays beneath the 200-SMA and portrays the “Bear Cross”, which in turn suggests further downside of the Silver Price. Also keeping the XAG/USD sellers hopeful is the commodity’s sustained trading below a three-week-long descending resistance line.
However, a horizontal area comprising multiple levels marked since June 23, close to $22.10–30, puts a floor under the XAG/USD price amid a nearly oversold RSI (14) line.
In a case where the Silver Price breaks the $22.10 support, it becomes vulnerable to testing the early March swing high of around $21.30 with the $22.00 threshold likely acting as an intermediate halt.
On the flip side, a clear break of the immediate resistance line, close to $22.85 at the latest, will direct the XAG/USD toward the 100-SMA hurdle of around $23.65. Though, the 200-SMA level of near $23.80 acts as the final defense of the Silver sellers.
Trend: Limited downside expected
Technical Levels: Supports and Resistances
XAGUSD currently trading at 22.54 at the time of writing. Pair opened at 22.6 and is trading with a change of -0.27% % .
| Overview | Overview.1 | |
|---|---|---|
| 0 | Today last price | 22.54 |
| 1 | Today Daily Change | -0.06 |
| 2 | Today Daily Change % | -0.27% |
| 3 | Today daily open | 22.6 |
The pair remains strongly bearish on the daily time frame. It trades below the 20 SMA @ 23.93, 50 SMA 23.64, 100 SMA @ 24.05 and 200 SMA @ 23.26.
| Trends | Trends.1 | |
|---|---|---|
| 0 | Daily SMA20 | 23.93 |
| 1 | Daily SMA50 | 23.64 |
| 2 | Daily SMA100 | 24.05 |
| 3 | Daily SMA200 | 23.26 |
The previous day high was 22.76 while the previous day low was 22.37. The daily 38.2% Fib levels comes at 22.52, expected to provide support. Similarly, the daily 61.8% fib level is at 22.61, expected to provide resistance.
Note the levels of interest below:
- Pivot support is noted at 22.39, 22.18, 21.99
- Pivot resistance is noted at 22.79, 22.97, 23.18
| Levels | Levels.1 |
|---|---|
| Previous Daily High | 22.76 |
| Previous Daily Low | 22.37 |
| Previous Weekly High | 23.68 |
| Previous Weekly Low | 22.58 |
| Previous Monthly High | 25.27 |
| Previous Monthly Low | 22.52 |
| Daily Fibonacci 38.2% | 22.52 |
| Daily Fibonacci 61.8% | 22.61 |
| Daily Pivot Point S1 | 22.39 |
| Daily Pivot Point S2 | 22.18 |
| Daily Pivot Point S3 | 21.99 |
| Daily Pivot Point R1 | 22.79 |
| Daily Pivot Point R2 | 22.97 |
| Daily Pivot Point R3 | 23.18 |
[/s2If]
Download Nehcap EAWe have two EAs that are operational on our LIVE accounts.
- EA-FIX: Check out the details here. Download EA-FIX . EA-FIX is a non-grid HFT scalper.
- EA-GROWTH: High quality low dd EA using trend grids. Download EA_GROWTHJoin Our Telegram Group
")


