The USDCNH currency pair, which was previously at a year-to-date high of 7.32082, has decreased in value and is now moving away from that high point. It has reached a new lowest point for the day, but this is seen as a temporary setback in its four-day upward trend. According to the opinion of the market analyst, there is not expected to be a significant decrease in value.
…
This is a premium post.
[s2If !current_user_can(access_s2member_level4)]Please register for FREE REGISTER to read full post below containing analysis. In case of any error or you think you are not able to read the full post below, please email us at support#nehcap.com [lwa][/s2If] [s2If current_user_can(access_s2member_level1)]
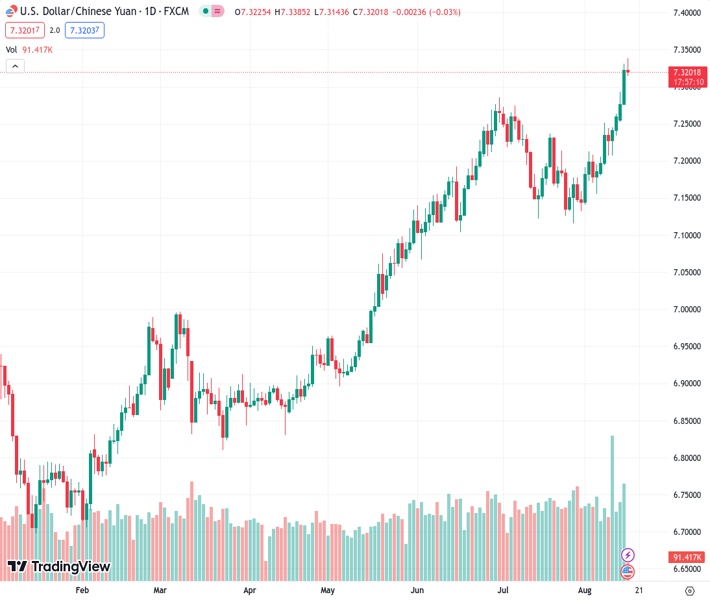
- USD/CNH retreats from YTD high, renews intraday bottom to prod four-day uptrend.
The pair currently trades last at 7.32082.
The previous day high was 7.3312 while the previous day low was 7.2766. The daily 38.2% Fib levels comes at 7.3104, expected to provide support. Similarly, the daily 61.8% fib level is at 7.2975, expected to provide support.
USD/CNH takes offers to refresh intraday low near 7.3160 during early Wednesday morning in China. In doing so, the offshore Chinese Yuan (CNH) pair reverses from the Year-To-Date (YTD) high marked earlier in the day as markets prepare for the Federal Open Market Committee (FOMC) Monetary Policy Meeting Minutes.
Also read: Forex Today: US data keeps the Dollar at monthly highs
It’s worth noting that the downbeat print of China House Price Index for July, -0.1% versus 0.0% prior, joins the previously released disappointing Industrial Production and Retail Sales for the said month to keep the USD/CNH buyers hopeful despite the latest pullback.
That said, the overbought RSI (14) line joins the market’s pre-event consolidation to direct the USD/CNH price towards the previous resistance line stretched from late October 2022, around 7.2680 at the latest. During the anticipated fall, the 7.3000 threshold might act as an intermediate halt.
However, the USD/CNH bulls remain hopeful unless the Yuan pair remains within an ascending trend channel comprising multiple levels marked since late February, currently between 7.3950 and 7.1730.
Meanwhile, a horizontal area comprising multiple tops marked during late 2022, around 7.3550–3750 appears a tough nut to crack for the USD/CNH bulls, especially amid the overbought RSI conditions.
Trend: Limited downside expected
Technical Levels: Supports and Resistances
USDCNH currently trading at 7.317 at the time of writing. Pair opened at 7.3242 and is trading with a change of -0.10% % .
| Overview | Overview.1 | |
|---|---|---|
| 0 | Today last price | 7.317 |
| 1 | Today Daily Change | -0.0072 |
| 2 | Today Daily Change % | -0.10% |
| 3 | Today daily open | 7.3242 |
The pair remains strongly bullish on the daily timeframe. It trades above its 20 SMA @ 7.2036, 50 SMA 7.1987, 100 SMA @ 7.0799 and 200 SMA @ 7.0015.
| Trends | Trends.1 | |
|---|---|---|
| 0 | Daily SMA20 | 7.2036 |
| 1 | Daily SMA50 | 7.1987 |
| 2 | Daily SMA100 | 7.0799 |
| 3 | Daily SMA200 | 7.0015 |
The previous day high was 7.3312 while the previous day low was 7.2766. The daily 38.2% Fib levels comes at 7.3104, expected to provide support. Similarly, the daily 61.8% fib level is at 7.2975, expected to provide support.
Note the levels of interest below:
- Pivot support is noted at 7.2902, 7.2561, 7.2356
- Pivot resistance is noted at 7.3448, 7.3653, 7.3994
| Levels | Levels.1 |
|---|---|
| Previous Daily High | 7.3312 |
| Previous Daily Low | 7.2766 |
| Previous Weekly High | 7.2634 |
| Previous Weekly Low | 7.1824 |
| Previous Monthly High | 7.2744 |
| Previous Monthly Low | 7.1160 |
| Daily Fibonacci 38.2% | 7.3104 |
| Daily Fibonacci 61.8% | 7.2975 |
| Daily Pivot Point S1 | 7.2902 |
| Daily Pivot Point S2 | 7.2561 |
| Daily Pivot Point S3 | 7.2356 |
| Daily Pivot Point R1 | 7.3448 |
| Daily Pivot Point R2 | 7.3653 |
| Daily Pivot Point R3 | 7.3994 |
[/s2If]
Download Nehcap EAWe have two EAs that are operational on our LIVE accounts.
- EA-FIX: Check out the details here. Download EA-FIX . EA-FIX is a non-grid HFT scalper.
- EA-GROWTH: High quality low dd EA using trend grids. Download EA_GROWTHJoin Our Telegram Group
")


