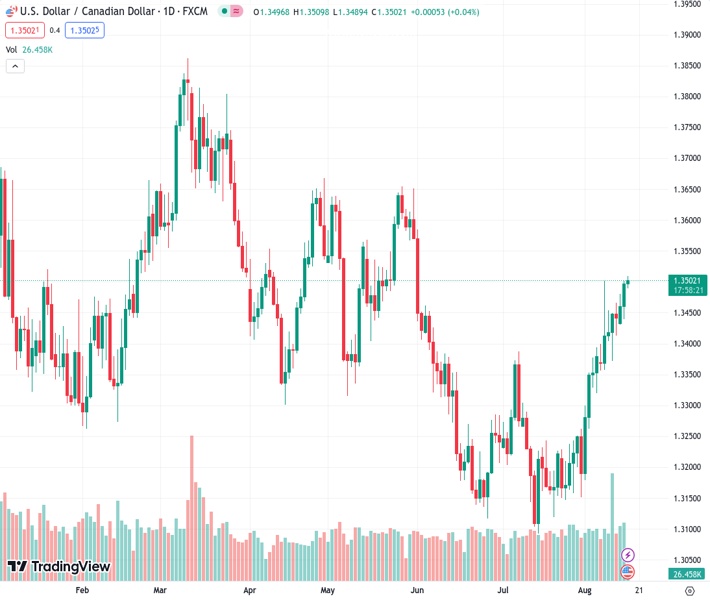
The USDCAD pair has reached its highest point since the beginning of June at a rate of 1.35028. However, it is facing difficulties in fully taking advantage of this upward trend.
…
This is a premium post.
[s2If !current_user_can(access_s2member_level4)]Please register for FREE REGISTER to read full post below containing analysis. In case of any error or you think you are not able to read the full post below, please email us at support#nehcap.com [lwa][/s2If] [s2If current_user_can(access_s2member_level1)]
- USD/CAD climbs to its highest level since early June, albeit struggles to capitalize on the momentum.
The pair currently trades last at 1.35028.
The previous day high was 1.3502 while the previous day low was 1.3439. The daily 38.2% Fib levels comes at 1.3478, expected to provide support. Similarly, the daily 61.8% fib level is at 1.3463, expected to provide support.
The USD/CAD pair climbs to a fresh high since early June during the Asian session on Wednesday, albeit continues with its struggle to find acceptance or build on the momentum beyond the 1.3500 psychological mark.
The US Dollar (USD) remains below its highest level in more than two months touched earlier this week as bulls seem reluctant to place aggressive bets in the wake of the uncertainty over the Federal Reserve’s (Fed) future rate hike path. This, in turn, is seen as a key factor acting as a headwind for the USD/CAD pair, though weaker Crude Oil prices d undermines the commodity-linked Loonie and should help limit the downside, at least for the time being.
A 20 points slump in the Empire State Manufacturing Index to a reading of -19 in August reaffirmed market expectations that the Fed will pause its rate-hiking cycle at the upcoming meeting in September. That said, the upbeat US Retail Sales data released on Tuesday indicated that consumer spending held up well in July and pointed to an extremely resilient economy, which keeps the door open for one-more 25 bps lift-off by the end of this year.
Hence, the market focus will remain glued to the release of the FOMC meeting minutes, due later during the US session. Investors will look for fresh cues about the Fed’s near-term policy outlook, which will influence the USD price dynamics and provide a fresh impetus to the USD/CAD pair. In the meantime, bets that the Fed will keep interest rates higher for longer remain supportive of elevated US Treasury bond yields and lend support to the buck.
It is worth recalling that yield on the benchmark 10-year US government bond shot to a nearly 10-month top on Tuesday before easing below the 4.20% level. Nevertheless, the aforementioned fundamental backdrop favours the USD bulls. This, along with the overnight muted reaction to stronger Canadian consumer inflation figures, validates the positive outlook and suggests that the path of least resistance for the USD/CAD pair is to the upside.
Market participants now look forward to the US economic docket – featuring the release of Building Permits, Housing Starts and Industrial Production figures later during the early North American session. This, along with the US bond yields and the broader risk sentiment, will drive demand for the safe-haven USD. Apart from this, Oil price dynamics should contribute to producing short-term trading opportunities around the USD/CAD pair.
Technical Levels: Supports and Resistances
USDCAD currently trading at 1.3503 at the time of writing. Pair opened at 1.3498 and is trading with a change of 0.04 % .
| Overview | Overview.1 | |
|---|---|---|
| 0 | Today last price | 1.3503 |
| 1 | Today Daily Change | 0.0005 |
| 2 | Today Daily Change % | 0.0400 |
| 3 | Today daily open | 1.3498 |
The pair remains strongly bullish on the daily timeframe. It trades above its 20 SMA @ 1.331, 50 SMA 1.3271, 100 SMA @ 1.3384 and 200 SMA @ 1.3451.
| Trends | Trends.1 | |
|---|---|---|
| 0 | Daily SMA20 | 1.3310 |
| 1 | Daily SMA50 | 1.3271 |
| 2 | Daily SMA100 | 1.3384 |
| 3 | Daily SMA200 | 1.3451 |
The previous day high was 1.3502 while the previous day low was 1.3439. The daily 38.2% Fib levels comes at 1.3478, expected to provide support. Similarly, the daily 61.8% fib level is at 1.3463, expected to provide support.
Note the levels of interest below:
- Pivot support is noted at 1.3457, 1.3417, 1.3395
- Pivot resistance is noted at 1.352, 1.3542, 1.3582
| Levels | Levels.1 |
|---|---|
| Previous Daily High | 1.3502 |
| Previous Daily Low | 1.3439 |
| Previous Weekly High | 1.3502 |
| Previous Weekly Low | 1.3356 |
| Previous Monthly High | 1.3387 |
| Previous Monthly Low | 1.3093 |
| Daily Fibonacci 38.2% | 1.3478 |
| Daily Fibonacci 61.8% | 1.3463 |
| Daily Pivot Point S1 | 1.3457 |
| Daily Pivot Point S2 | 1.3417 |
| Daily Pivot Point S3 | 1.3395 |
| Daily Pivot Point R1 | 1.3520 |
| Daily Pivot Point R2 | 1.3542 |
| Daily Pivot Point R3 | 1.3582 |
[/s2If]
Download Nehcap EAWe have two EAs that are operational on our LIVE accounts.
- EA-FIX: Check out the details here. Download EA-FIX . EA-FIX is a non-grid HFT scalper.
- EA-GROWTH: High quality low dd EA using trend grids. Download EA_GROWTHJoin Our Telegram Group
")


