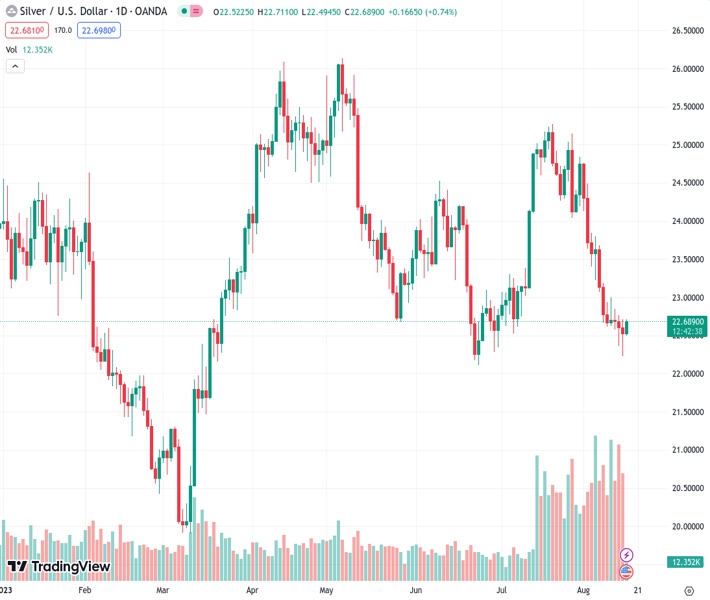
The price of silver, represented by #XAGUSD, has risen to 22.687, bouncing back from the lowest point it reached in almost two months on the previous day.
…
This is a premium post.
[s2If !current_user_can(access_s2member_level4)]Please register for FREE REGISTER to read full post below containing analysis. In case of any error or you think you are not able to read the full post below, please email us at support#nehcap.com [lwa][/s2If] [s2If current_user_can(access_s2member_level1)]
- Silver recovers further from a nearly two-month low touched the previous day.
The pair currently trades last at 22.687.
The previous day high was 22.71 while the previous day low was 22.23. The daily 38.2% Fib levels comes at 22.41, expected to provide support. Similarly, the daily 61.8% fib level is at 22.53, expected to provide support.
Silver gains some positive traction on Wednesday and builds on the previous day’s late rebound from the $22.20 area, or a nearly two-month low. The white metal extends its steady intraday ascent through the early part of the European session and climbs to a fresh daily high, around the $22.65-$22.70 region in the last hour.
From a technical perspective, the intraday strength beyond the 100-hour Simple Moving Average (SMA) might have already set the stage for a further appreciating move. Moreover, oscillators on the 1-hour chart have been gaining positive traction and are still far from being in the overbought zone, validating the constructive outlook. That said, it will still be prudent to wait for strong follow-through buying before confirming that the XAG/USD has formed a near-term bottom.
Moreover, technical indicators on the daily chart are still holding deep in the bearish territory. Apart from this, the recent break below the very important 200-day SMA suggests that the attempted recovery might still be seen as a selling opportunity and runs the risk of fizzling out rather quickly. Hence, any subsequent move up is more likely to confront stiff resistance near the $22.80-$22.85 region ahead of the $23.00 mark and the $23.25 region, or the 200-day SMA.
The latter should act as a key pivotal point, which if cleared might trigger a short-covering move and lift the XAG/USD to the $23.60-$23.65 horizontal barrier. Bulls might eventually aim to reclaim the $24.00 round figure.
On the flip side, the overnight swing low, around the $22.20 region, nearing the multi-month low, around the $22.15-$22.10 area touched in June, might continue to protect the immediate downside. Bearish traders might wait for some follow-through selling below the $22.00 mark before placing fresh bets. The XAG/USD might then accelerate the fall towards the $21.55-$21.50 area en route to the $21.00 round figure. The downward trajectory could get extended further towards intermediate support near the $20.60 area before Silver drops to the YTD low, or levels just below the $20.00 psychological mark touched in March.
Technical Levels: Supports and Resistances
XAGUSD currently trading at 22.69 at the time of writing. Pair opened at 22.52 and is trading with a change of 0.75 % .
| Overview | Overview.1 | |
|---|---|---|
| 0 | Today last price | 22.69 |
| 1 | Today Daily Change | 0.17 |
| 2 | Today Daily Change % | 0.75 |
| 3 | Today daily open | 22.52 |
The pair remains strongly bearish on the daily time frame. It trades below the 20 SMA @ 23.8, 50 SMA 23.62, 100 SMA @ 24.04 and 200 SMA @ 23.27.
| Trends | Trends.1 | |
|---|---|---|
| 0 | Daily SMA20 | 23.80 |
| 1 | Daily SMA50 | 23.62 |
| 2 | Daily SMA100 | 24.04 |
| 3 | Daily SMA200 | 23.27 |
The previous day high was 22.71 while the previous day low was 22.23. The daily 38.2% Fib levels comes at 22.41, expected to provide support. Similarly, the daily 61.8% fib level is at 22.53, expected to provide support.
Note the levels of interest below:
- Pivot support is noted at 22.26, 22.0, 21.78
- Pivot resistance is noted at 22.75, 22.97, 23.23
| Levels | Levels.1 |
|---|---|
| Previous Daily High | 22.71 |
| Previous Daily Low | 22.23 |
| Previous Weekly High | 23.68 |
| Previous Weekly Low | 22.58 |
| Previous Monthly High | 25.27 |
| Previous Monthly Low | 22.52 |
| Daily Fibonacci 38.2% | 22.41 |
| Daily Fibonacci 61.8% | 22.53 |
| Daily Pivot Point S1 | 22.26 |
| Daily Pivot Point S2 | 22.00 |
| Daily Pivot Point S3 | 21.78 |
| Daily Pivot Point R1 | 22.75 |
| Daily Pivot Point R2 | 22.97 |
| Daily Pivot Point R3 | 23.23 |
[/s2If]
Download Nehcap EAWe have two EAs that are operational on our LIVE accounts.
- EA-FIX: Check out the details here. Download EA-FIX . EA-FIX is a non-grid HFT scalper.
- EA-GROWTH: High quality low dd EA using trend grids. Download EA_GROWTHJoin Our Telegram Group
")


